SHEMETOV YEVGENY. STUDIES OF PHASE TRANSITIONS IN THE UNITED A2BX4 STRUCTURE β-K2SO4 METHOD NUCLEAR QUADRUPOLE RESONANCE
English abstract § 1.1 § 1.2 §1.3 § 1.4 § 2.1 § 2.2 §2.3 §2.4 § 3.1 § 3.2 § 3.3 § 3.4 § 4.1 § 4.2 § 4.3 § 4.4 Reference Template pdf abstract
§ 4.2. P-T phase diagram of Rb2ZnBr4.
In the beginning of this section briefly touch on issues of experimental measurements techniques not mentioned in Sec. 2. During the first stage, which was carried out in 1986-87, decided camping methodical task is to determine the possibility of equipment to record the "disproportionate" spectra at high pressures and determine increases or decreases the temperature range of the existence of Jc structure to such impacts [136,137]. This problem was originally solved by a high-temperature phase transition area using a titanium chamber NQR method and differential thermal analysis (DTA construct a cell for measurement is described in [74]). At temperatures below room used low-temperature cell HPC1. And only later, after the production of the second stage HPC2 managed to meet the challenge of a detailed study of structural changes in the Jc phase. In the study technique was used isobaric and isothermal changes of P-T parameters. The spectra were recorded with a temperature step of 5-100K and step pressure of 0.1-0.5 MPa. Frequency scanning range was from 55 to 78MGz. To control the sensitivity of the receiving path and to assess the impact of non-equilibrium processes in crystalline amplitude spectrum used NQR "frame". P-T field of study in HPC2 was 170-2900K at pressures up to 0.4 GPa. Above these pressures and temperatures data obtained HPC1. Total about 20 iso-sections. tracked, recorded more than 300 spectra. The samples of high quality obtained with the growth of single crystals for NMR experiments. Due to the fact that data obtained in HPC2 far been published only in a succinct form, we elaborate on their description in this paper.
On Fig.4.11 open circles marks the position of the differential thermal break in the temperature curve passing
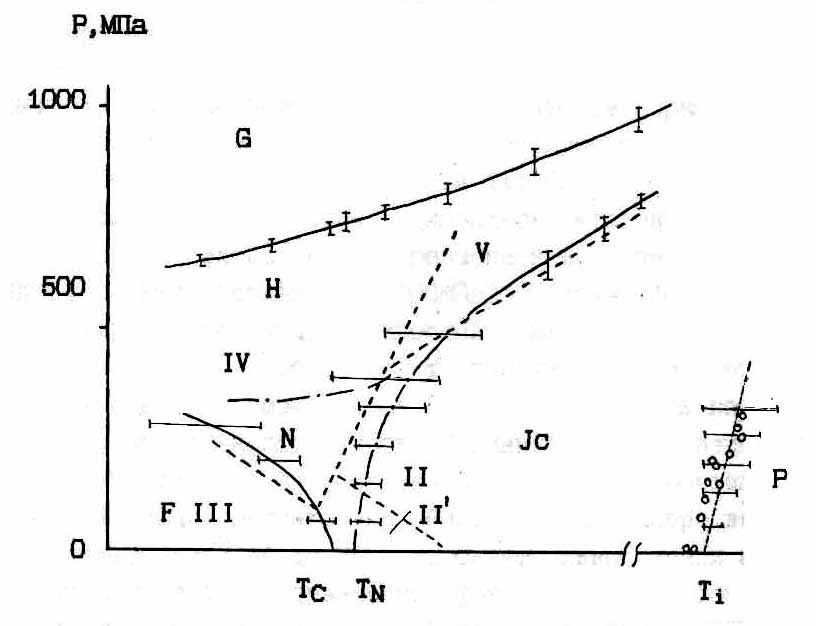
Figure 4.11. DTA data (open circles) near Ti, dielectric [59] (dotted lines, Roman notation) and NQR (continuous lines) measurements in the P-T region of the incommensurate phase of Rb2ZnBr4
P-Jc transition at different pressures. For comparison, in this figure, dotted line plotted P-Jc transition obtained later by Japanese researchers according dielectric measurements [59]. Note that the phase transition temperature Ti and DTA recorded at atmospheric pressure. differ by more than 5K.
NQR measurements in the area of Ti conducted on high-line absorption signal from nucleus ВrI.
(Presented below is a purely technical information intended for trainees and specialists experimenters. Panoramic reader can omit these routine details and go to page 127 and then 139.)
When isobaric changes in the phase transition observed "failure" in the intensity of this line, and at higher pressures, the line was not observable in a greater range of temperatures. These intentions have shown little promise HPC1 use design with a small diameter of the working channel for research NQR spectra near Ti. However, it was found that the temperature Ti with increasing pressure shifts to the high temperature region and the phase transition is smeared P-I (Fig.4.11).
Much more informative studies were NQR in the transition from the incommensurate to the ferroelectric phase. At low pressures 100MPa) near Jc, there was a marked increase in the intensities of the NQR lines of type N. With increasing pressure, the temperature region where these lines appear in the spectrum, expanding that recorded by changes in relative intensities of the "clean" lines of type N, NJ overlapped and FN and F types of spectral lines. The relative intensities of the course is illustrated by the example of Fig.4.12 lines F10 and N10. In the pressure range up to 250MPa. The spectral lines of these types coexist in the incommensurate phase. Intensities of the lines of type N increases gradually and at pressures higher than 250MPa spectrum consists of 14 discrete lines, which were correlated with the existence in this pressure commensurate phase N.
In isobaric measurements at проходах 200MPa with decreasing temperature, a phase transition to the ferroelectric structure, which is characterized by intense 12 discrete absorption NQR (line Fl - F12). With increasing temperature above 2100K spectra intensity gradually decreases. Area of P-T parameters (where the overall intensity of the spectra decreases) designated by us Jc symbol on Fig.4.11 can be roughly separated from the rest of the low-temperature region of the incommensurate phase.
During the measurements, it was also found that the isobaric passages corresponding to high pressures from the incommensurate phase transitions (Jc) in the N phase and ferroelectric phase strongly blurred. Changes in the intensities F, N and overlain
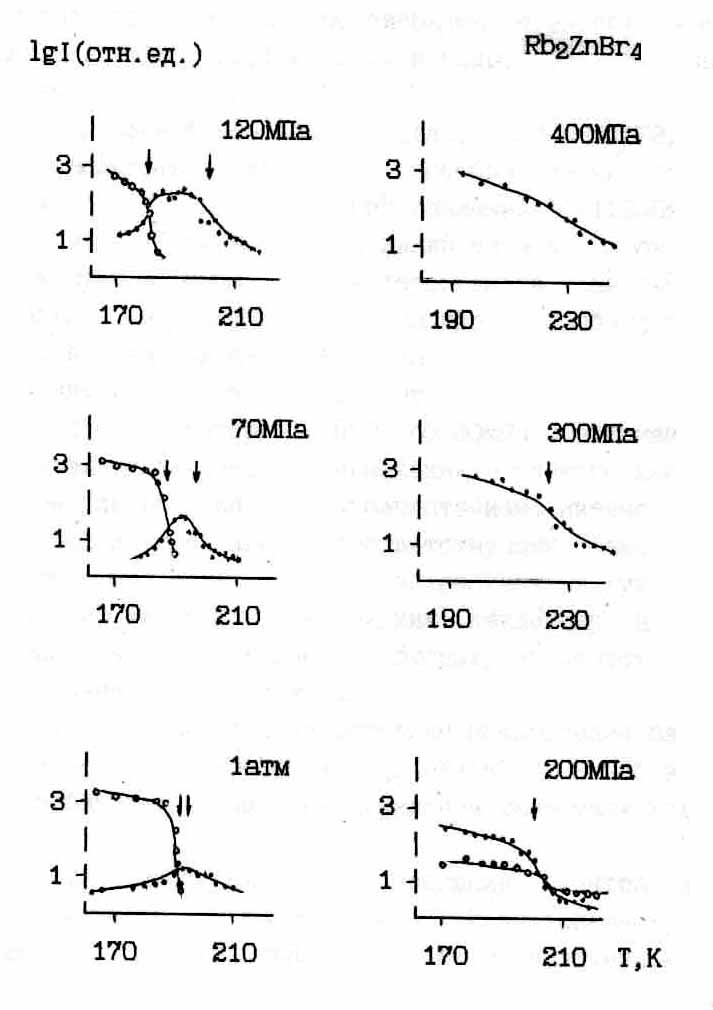
Fig.4.12 The relative intensity of the spectral lines NQR F10 and N10 at different pressures.
groups of lines are so gentle that above 150MPa definition phase transitions becomes difficult. Fig.4.11 on the phase diagram based on the results of isobaric studies [116,118,136,137]. Experimental data suggest the possibility of a more complex structural changes in the N phase. These assumptions were confirmed by us in isothermal studies CPH2 [111,112,116], for a detailed exposition of which we proceed.
Increased pressure in the F phase (isotherm 173, 183 and 188K) possible to observe the following transformations NQR spectra: Fig.4.13, 4.14 and 4.16. Pressures up to 90-110MPa observed only 12 lines of F type. Traces type lines N, due to the lower sensitivity in a bomb than a heat chamber, is not recorded. The above values range complemented weak spectral lines of type N (shaded areas on the spectrum Fig.4.13 and 4.14). Their intensity increases with increasing pressure to ~ 150MPa, and further in the range of DP ~ 60¸30MPa stabilized. With further increase of pressure changes in the spectrum are characterized by the disappearance of the lines of type F, increase the intensity of the N lines and the appearance of lines corresponding phase H: H-lines. Intensity increases dramatically past a narrow range of pressures above 250¸280MPa and at higher pressures there is powerful resonance lines 14, two of which, at frequencies 65.8 MHz and 66.7 have twice the strength.
On Fig.4.15 presented as an illustration of the baric stroke frequency of the NQR spectrum of Rb2ZnBr4 at T = 183K. In the phase transition region the slope of the frequency of moves and jumps NQR frequencies.
Features isothermal evolution of the spectrum in the P-T field is an extension of P-interval overlap (coexistence) lines of type F and N with increasing temperature isotherm. So at 1890K coexistence region F and N spectral lines is about 30MPa at 1880K 40MPa and at 1730K - £10MPa. However, the transition to the isobaric change in temperature in the range 160-200MPa, the coexistence lines of type F, N and H extends over a wide temperature range over 400K and 200MPa isobar on phase transitions in H or F phase was not observed up to 150K. These data indicate that the region of coexistence the phases dependent on the direction of change of the parameters P- T in relation to the P-T-phase lines.
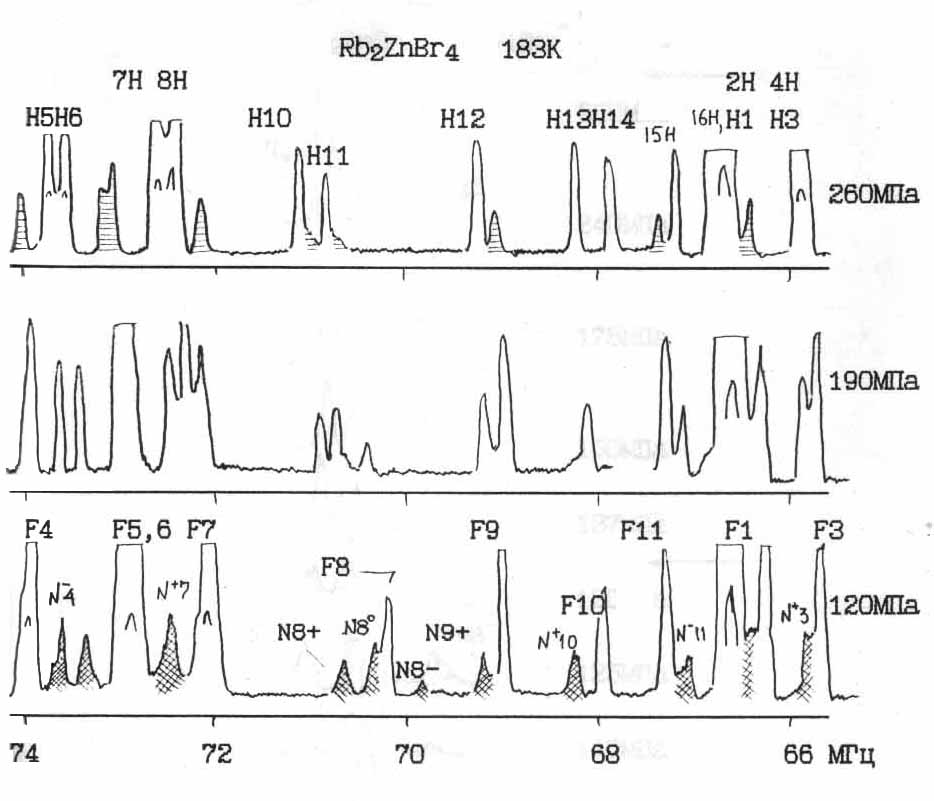
Fig. 4.13. Full Br NQR spectrum in RZB at T = 1830K and different pressures.
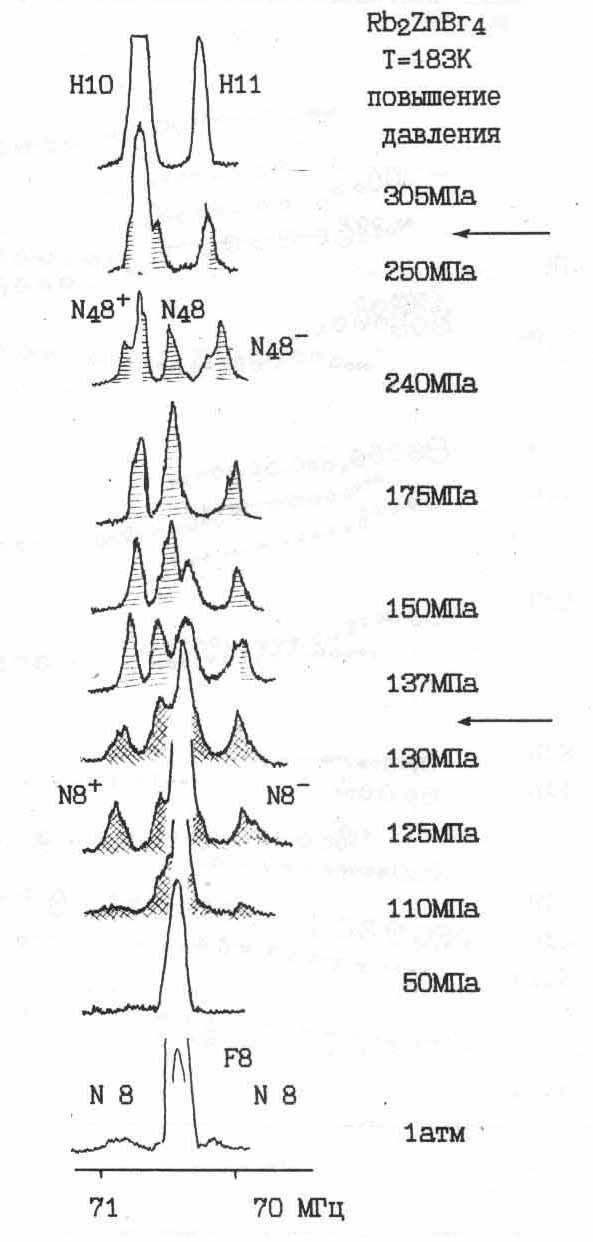
Fig.4.14. Changing of the NQR spectrum with increasing pressure at T = 1830K.
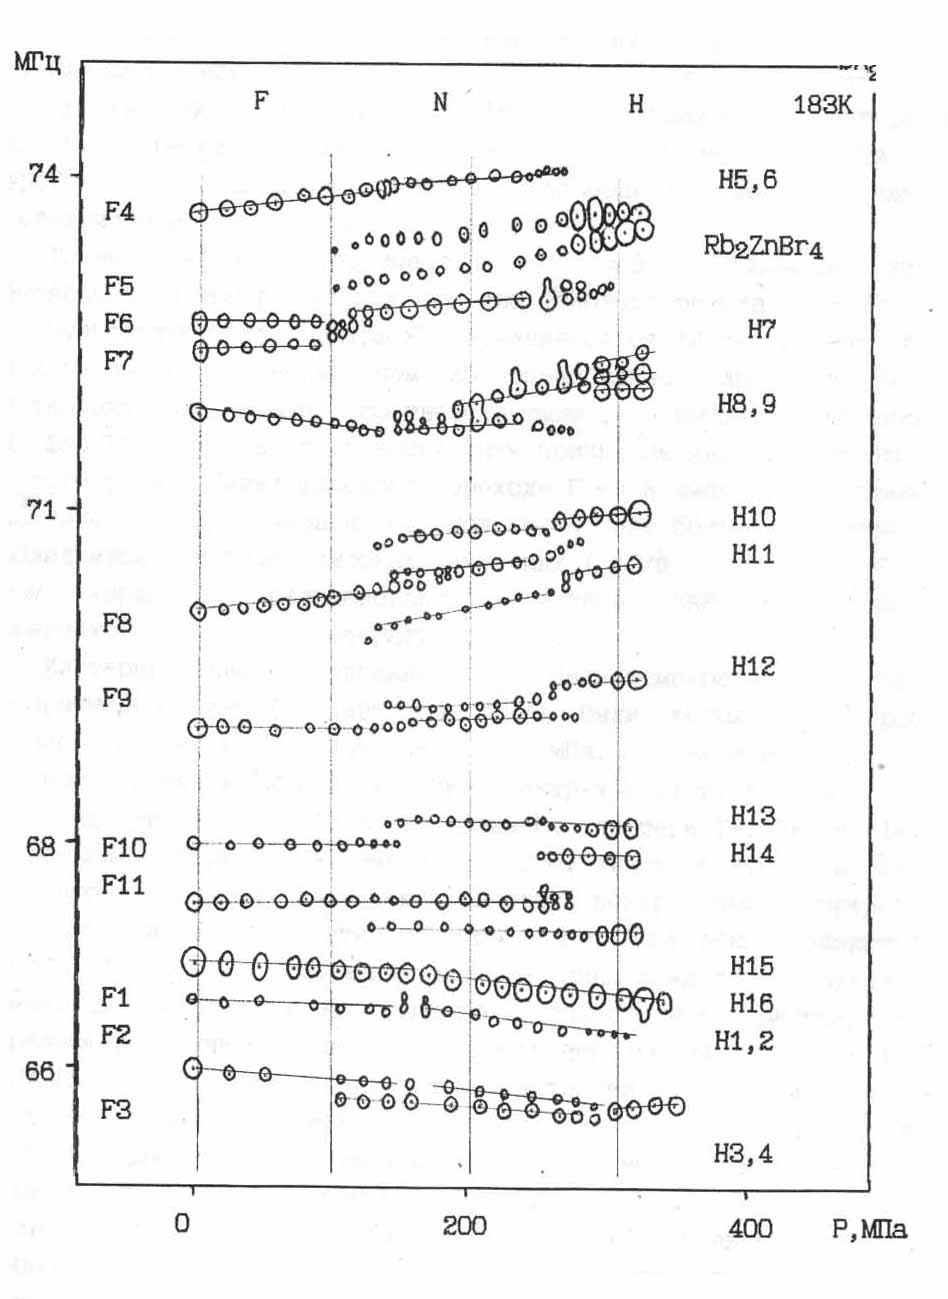
Fig. 4.15. Baric stroke line frequencies of the NQR spectrum at T = 1830K.
As the pressure decreases from phase H hysteresis of phase transitions. To move H ↔ N DР 20 ¸40MPa, the transition F ↔ N DР from 30 to 6OMPa where value increases with increasing temperature.
Thus isothermal method at low temperatures clearly recorded two phase transitions F↔N and N↔N. Multiplicity NQR spectrum varies from 12 lines of singlet type F, through no less than 20 spectral lines of N type to sixteen NQR lines, corresponding to the high pressure phase N. Both phase transitions in classical featured are first-order transitions. Phase transition line F↔N is negative ∂Р/∂T Phase transition H↔N at high temperatures observed at higher pressures (∂Р/∂T = 2,86 MPa/K) with a character transformation spectra NQR does not change significantly at temperatures up to 210K.
Isothermal studies in the field of low-temperature incommensurate phase (from 1890K to 2000K) were performed in detail with step 10¸ pressure 50MPa. Let us consider the general patterns observed in the NQR spectra in this area.
On Fig.4.16 and 4.17 for example isotherms T = 1980K and T = 1900K presented baric Frequency spectrum lines. Due to the fact that in this area of P-T observed spectral distribution with a complex change in intensity on the pressure dependence (Fig.4.17), except for specifying the frequency of the peak of each distribution, a closed oval contour scheduled spectral distributions that reflect their intensity and area of overlap. On Fig.4.26 and 4.27 are graphs of peak intensities. With increasing pressure, the overall intensity of the spectra increases and decreases the half-width frequency distributions. At a certain pressure, in the absence of frequency overlap, have seen the emergence of new lines (for example N8+, N8-, N11+ )Fig.4.17. P-T boundary area of occurrence of these lines at high temperatures is shifted to higher pressures and the phase diagram it is possible to compare a certain P-T line at = 150MPa and 2000K (Fig.4.24). When crossing this line is also measured the change in peak intensities most NQR signals. With decreasing, the pressure indicated
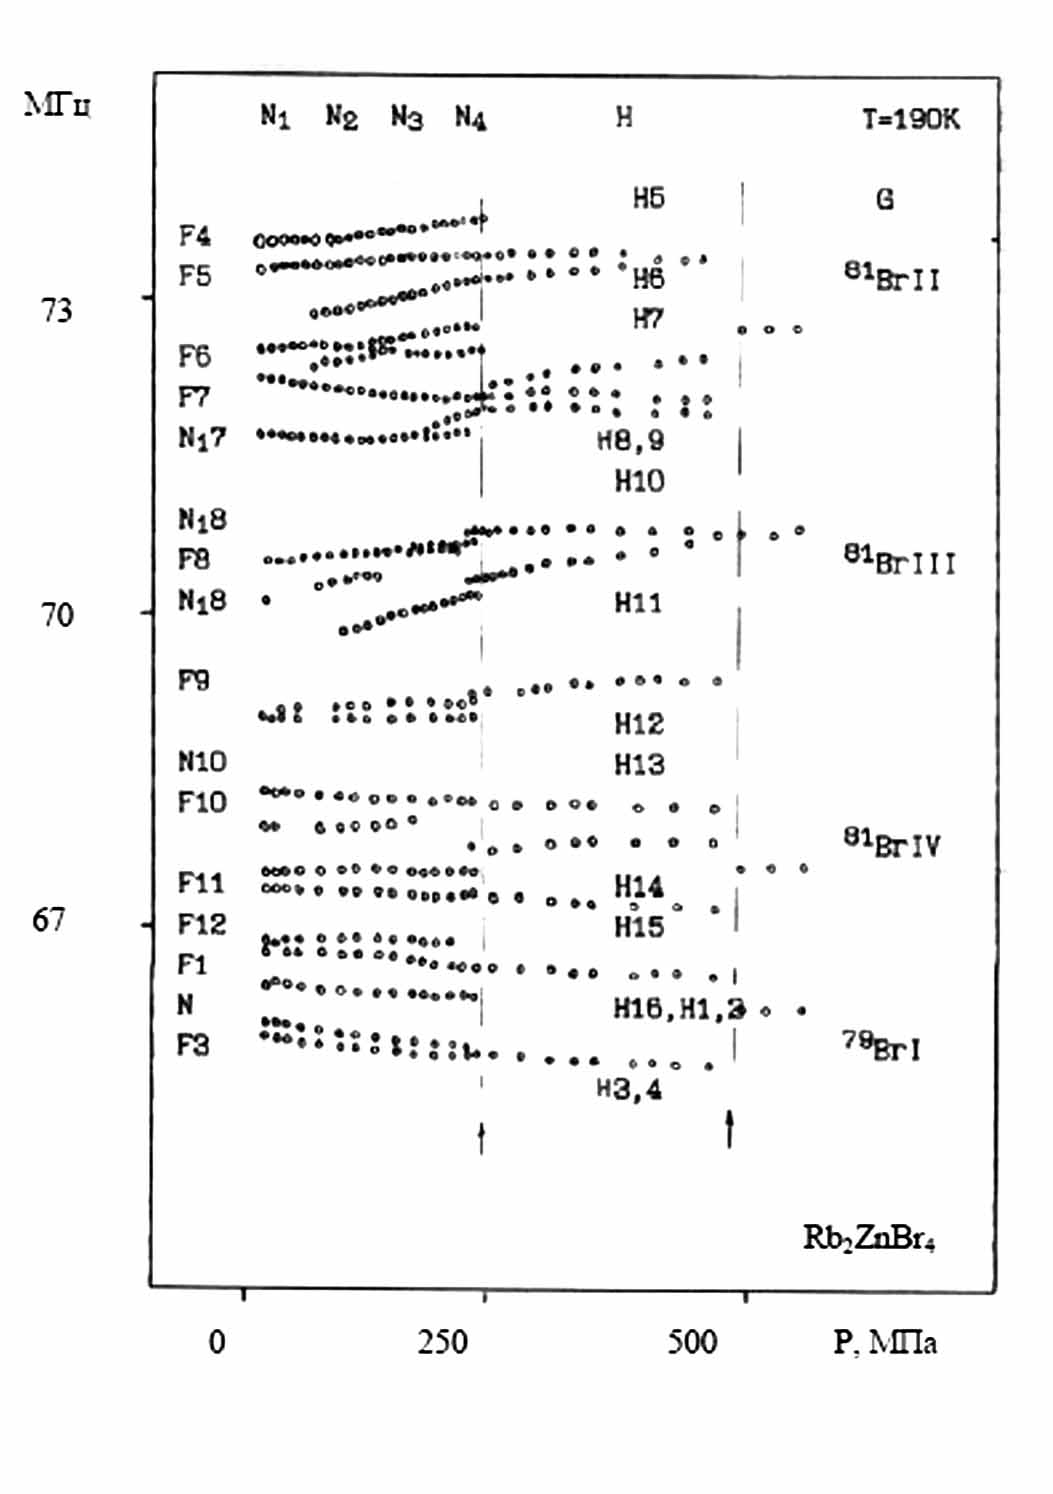
Fig. 4.16. Baric move NQR frequencies at T = 1900K.
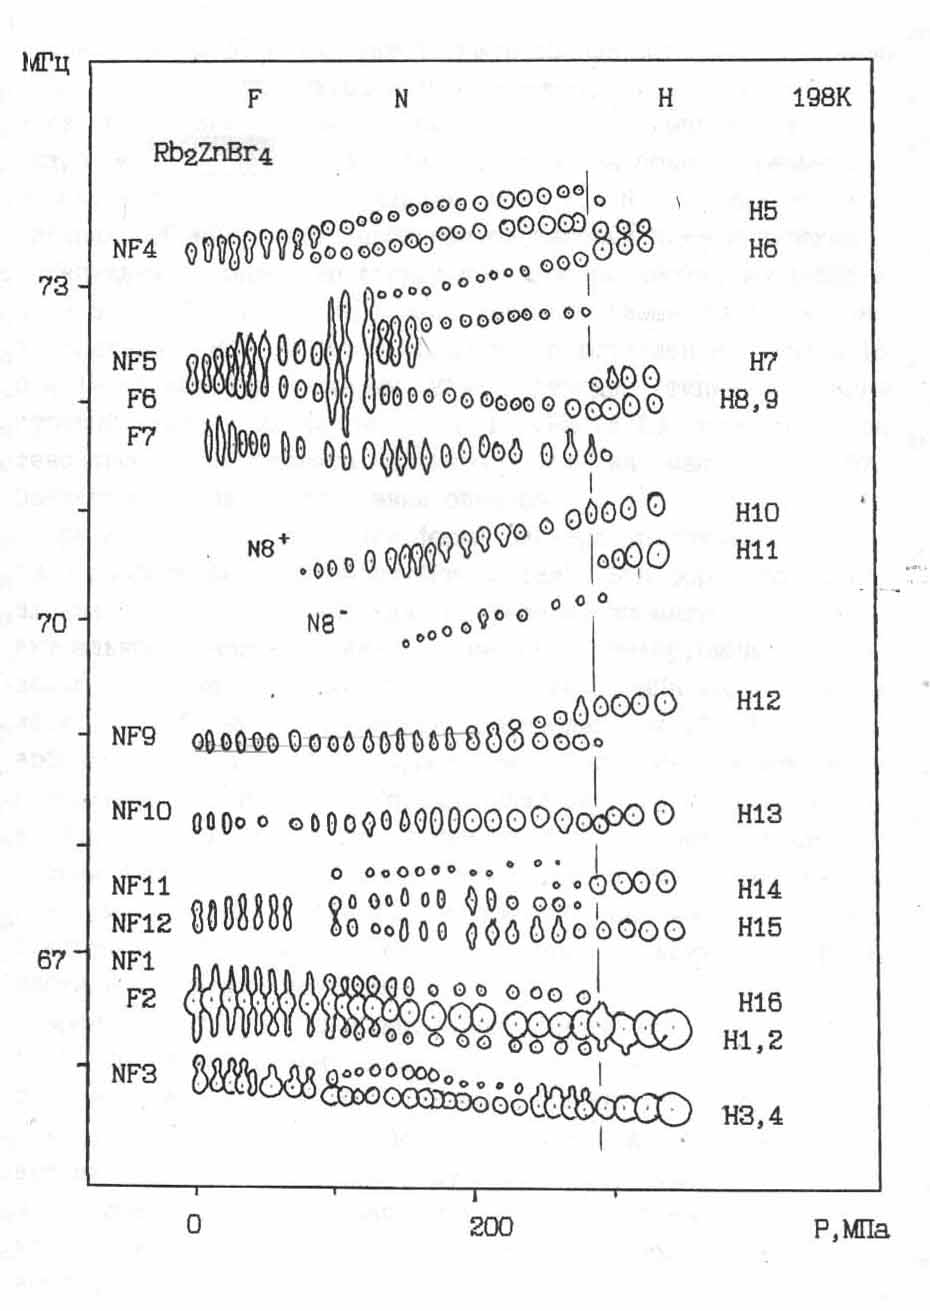
Fig. 4.17. Baric move NQR frequencies at T = 1980K.
hysteresis in the position marked abnormalities ΔР 40MPa.
Thus, all indications in phase N, a phase transition from a phase existing near atmospheric pressure to a phase N4, the previous high-symmetry phase N. A detailed analysis of the spectral data (see § 4.3) shows that the evolution of the NQR spectrum in the P-T region is represented by a more complex way than the coexistence of spectral lines F, N, NJ HN or type. At pressures of ~ 260MPa, clearly observed phase N↔H transition.
We now describe the data in isothermal studies CHP2 in the middle region of the incommensurate phase (above 200K). The characteristic form of NQR spectra in this area is presented in Fig.4.18. Fig.4.19 on the example shows a typical isotherm 2190K baric frequency dependence of NQR lines, and change Fig.4.20 peak intensity spectral component at the frequency J14 - 67.3 MHz, which is characteristic for the other lines of the spectrum.
At atmospheric pressure, the shape of the spectrum is represented by a small number of resolved components (Fig.4.18a). This form is maintained until the pressure 200MPa, where there is the first anomaly. So blurred spectral distribution at frequencies 69¸ 66,5 MHz (line group conventionally designated J13-J16) above 200MPa varies considerably (Fig.4.18b). Shape of the spectral distribution J5-J6 and J7-J8 also converted by increasing the circuit under their new spectral components. Group lines J1-J4, at atmospheric pressure characterized by a continual distribution between edge peaks above 200MPa proceeds to the frequency resolution of the form M1 - M4. Absorption signals at frequencies 70-70,5 MHz observed only above 200MPa, and at high temperatures in all of high pressures.
Also noticeable transformation of the spectrum shape (Fig.4.18a and 4.18b) measured the change in the half-width distributions and their peak intensities (Fig.4.20). Thus, a phase transition from a phase of Jc to a new phase marked by us symbol M1. With increasing temperature recorded overall reduction ratio S/N Features characterizing the anomaly Jc↔M1 becoming less distinct and isotherm 2500K completely blurred. When the pressure is reduced there is a significant hysteresis of the phase transition Jc↔M1 about DP 160MPa. Fig.4.24. Marked change in the slope of the phase transition to negative ∂Р/∂T = -75Pa/K.
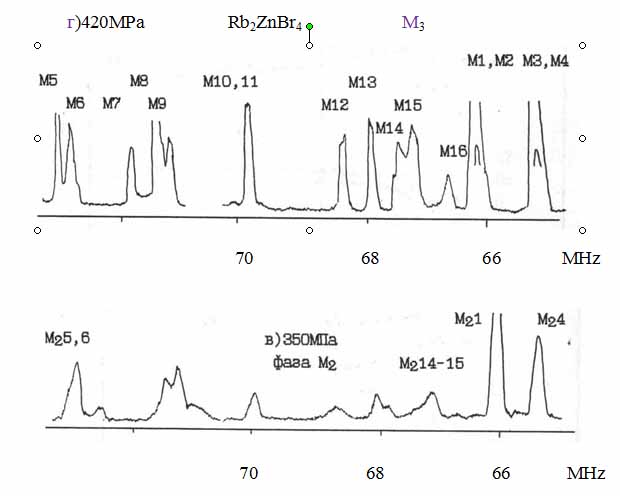
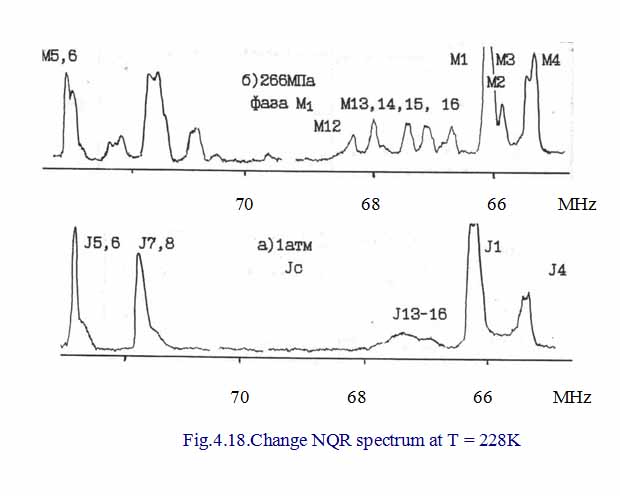
Fig.4.18.Change NQR spectrum at T = 190K
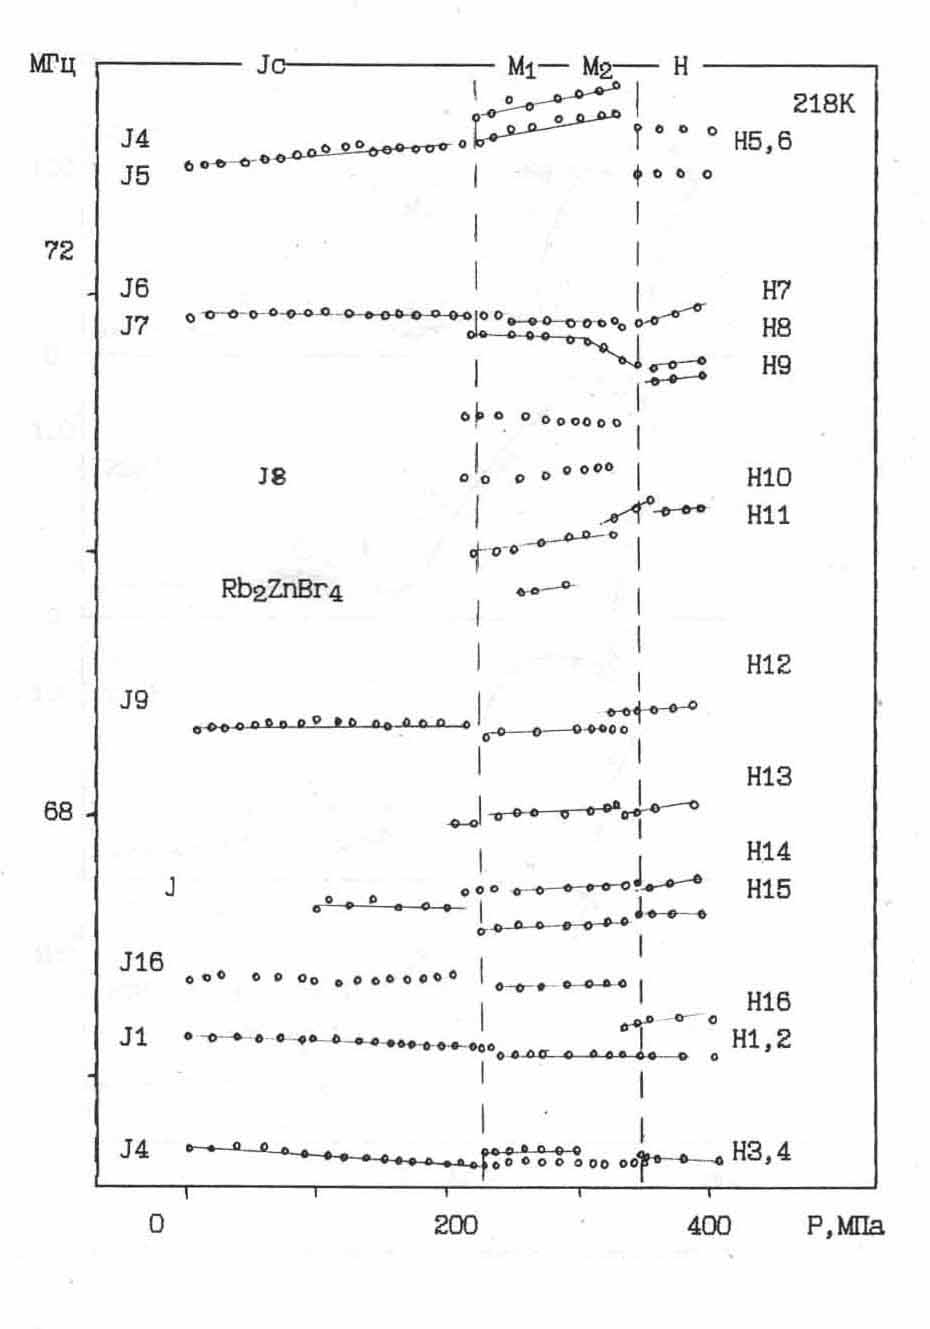
Fig.4.19. Baric move NQR frequencies at T = 218K.
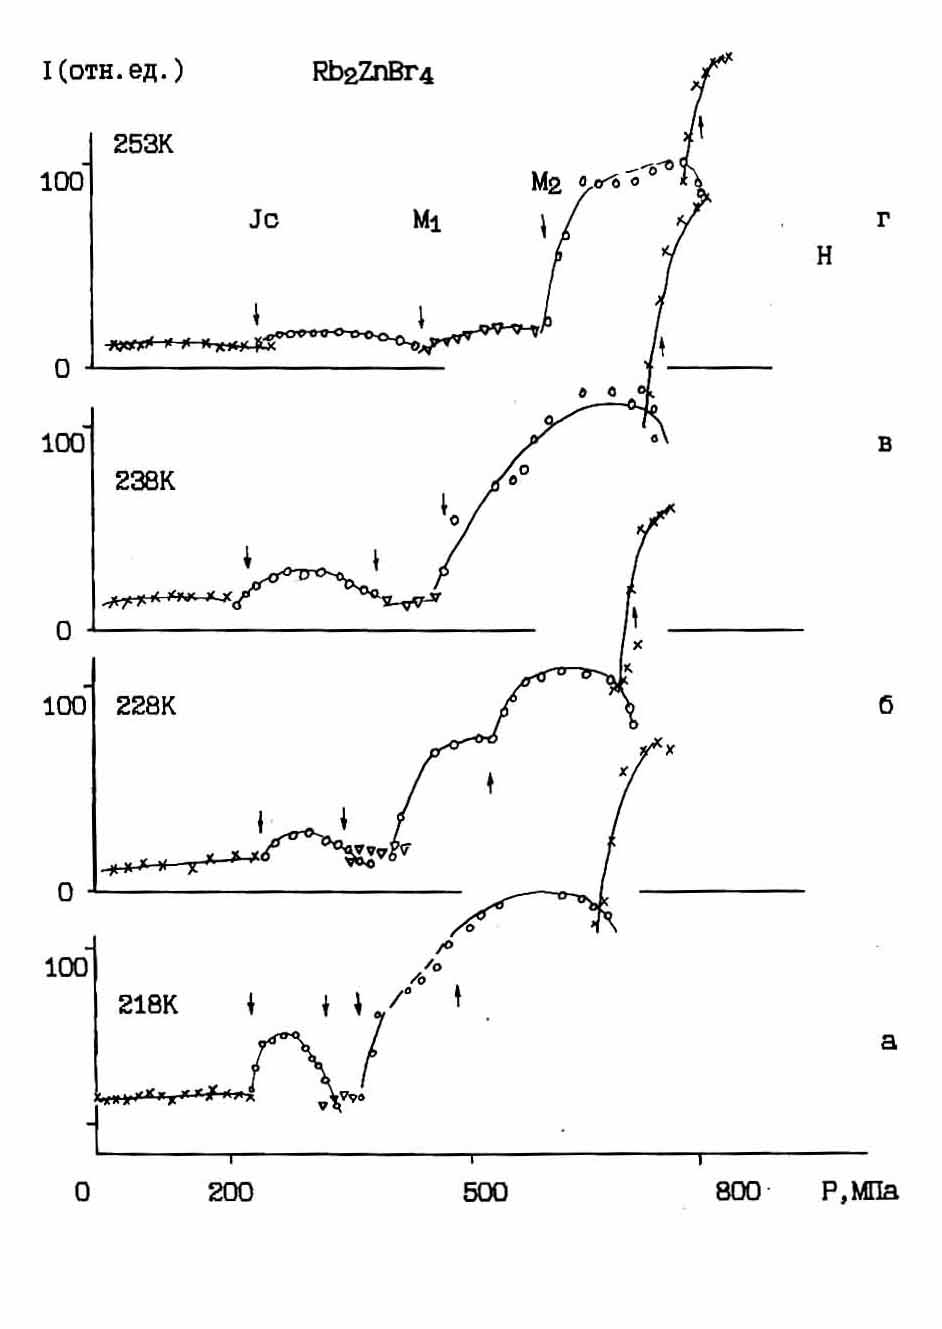
Рис.4.20а-г. Барическое изменение интенсивности линий спектра ЯКР типа J4-М14 при разных температурах.
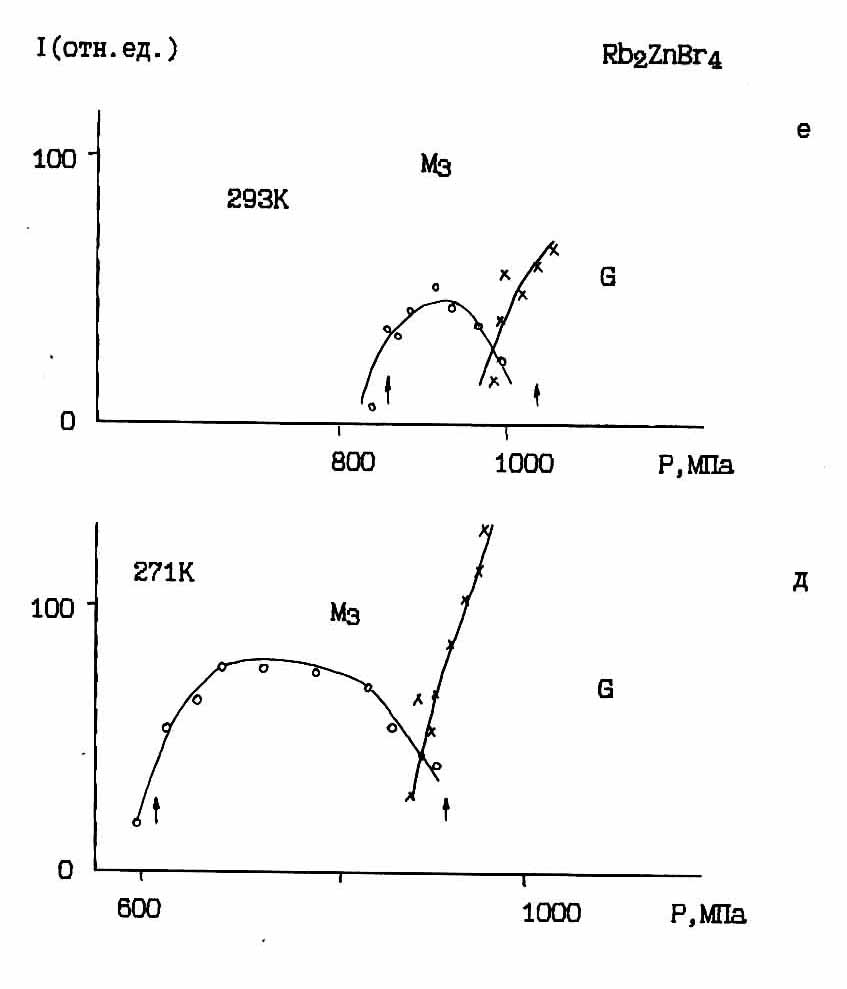
Fig.4.20a-g. Baric change in the intensity of the spectral lines NQR type J4-M14 at different temperatures.
Fig.4.20d th. Baric change in the intensity of the spectral lines NQR type J14-M14 at different temperatures
As the pressure increases in this temperature range by a second anomaly. It is characterized by changes in the forms of spectral distributions (Fig.4.186 and 4.18v), especially during the peak intensities of all lines (Fig.4.go), as well as a notable change in the frequencies of spectral peaks and slopes of the frequency dependencies (Fig.4.19).
Transition into a new phase, which we denote by M2, with increasing temperature isotherm is shifted to higher pressures with a positive slope with respect to the temperature axis ∂Р/∂Т ≈ 110Pa/0K .At temperatures above 2600K transition line M1↔M2 is not tracked due to the excess of its intended position limit values HPC2 pressure, and in the case HPC1 not sufficient sensitivity of the apparatus. Hysteresis transition M2↔ measured isotherm 2110K is about 50MPa.
When pressure rises above 400MPa width of the spectral distributions decrease at a certain pressure and intensity of the NQR lines increases sharply, then stabilized again (Fig.4.21 and 4.22). There is a new spectral line frequency offset with respect to the spectral lines of phase M2. This spectral anomaly, we compared with the phase transition into the next phase of high pressure М3. Position of the transition points determined from the inflection in the course of baric intensities of the NQR lines M12-M16 (Fig.4.22). At high temperatures, the anomaly in the transition М2↔М3 is fixed much clearer. The slope of the transition line between phases M2 and M3 is ∂Р/∂Т =*8MPa/K. Hysteresis transition ΔР ≈40MPa.
Thus, when the pressure in the middle of the incommensurate phase observed sequence of phase transitions J↔ М1 ↔ М2 М2↔М3 The decrease in the width of the spectral lines indicates the ordering of the incommensurate structure with increasing pressure.
With increasing pressure above 500MPa, or with decreasing temperature below 2500K in this P region, the shape of the NQR spectrum continues to change (Fig.4.23) and transformed to characteristic of phase N. Due to the large step measurements (5-10K, 50MPa) in the P-T range, and the vagueness of the anomaly, the proposed line separating phase M3 and H is fixed with a large error.
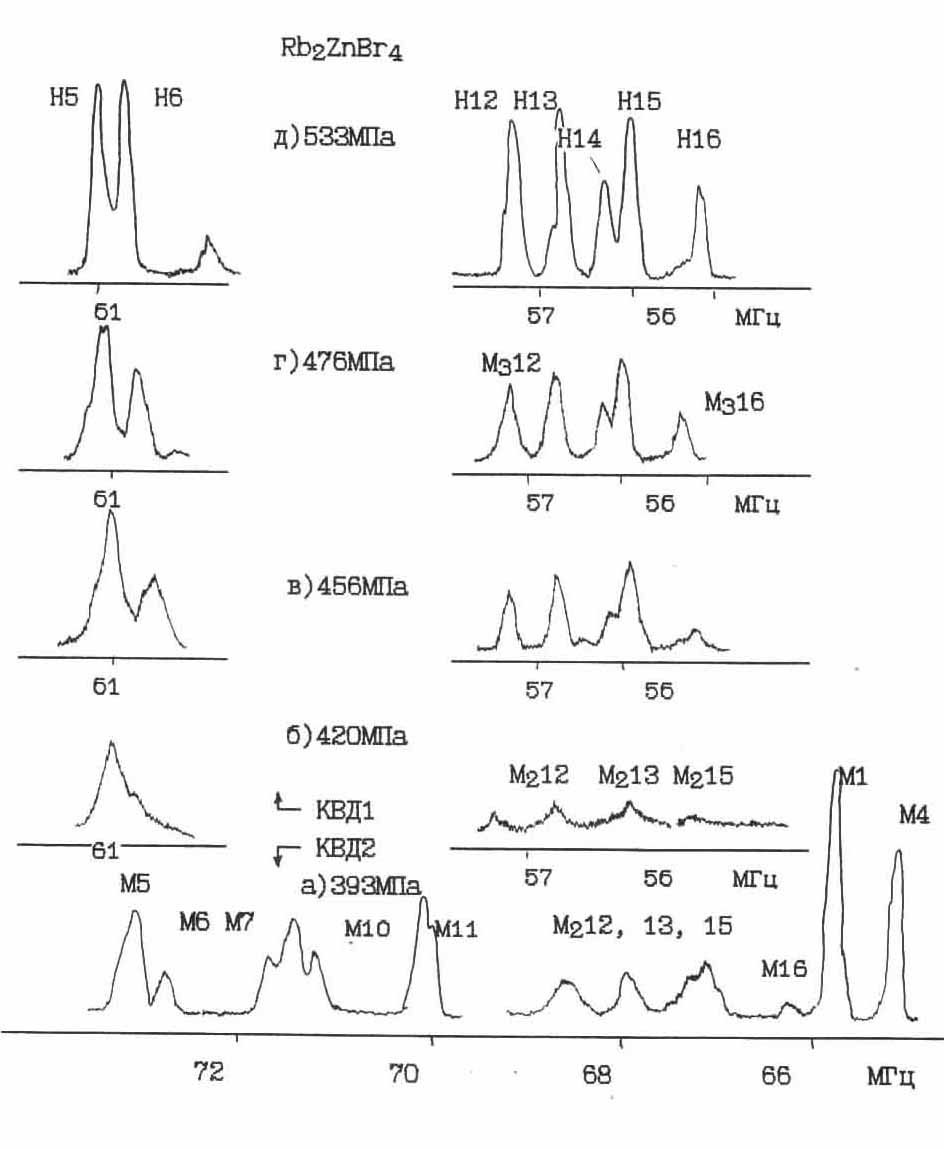
Fig.4.21. Convert NQR spectrum in the phase transition M2 ↔ M3 M3↔ H.
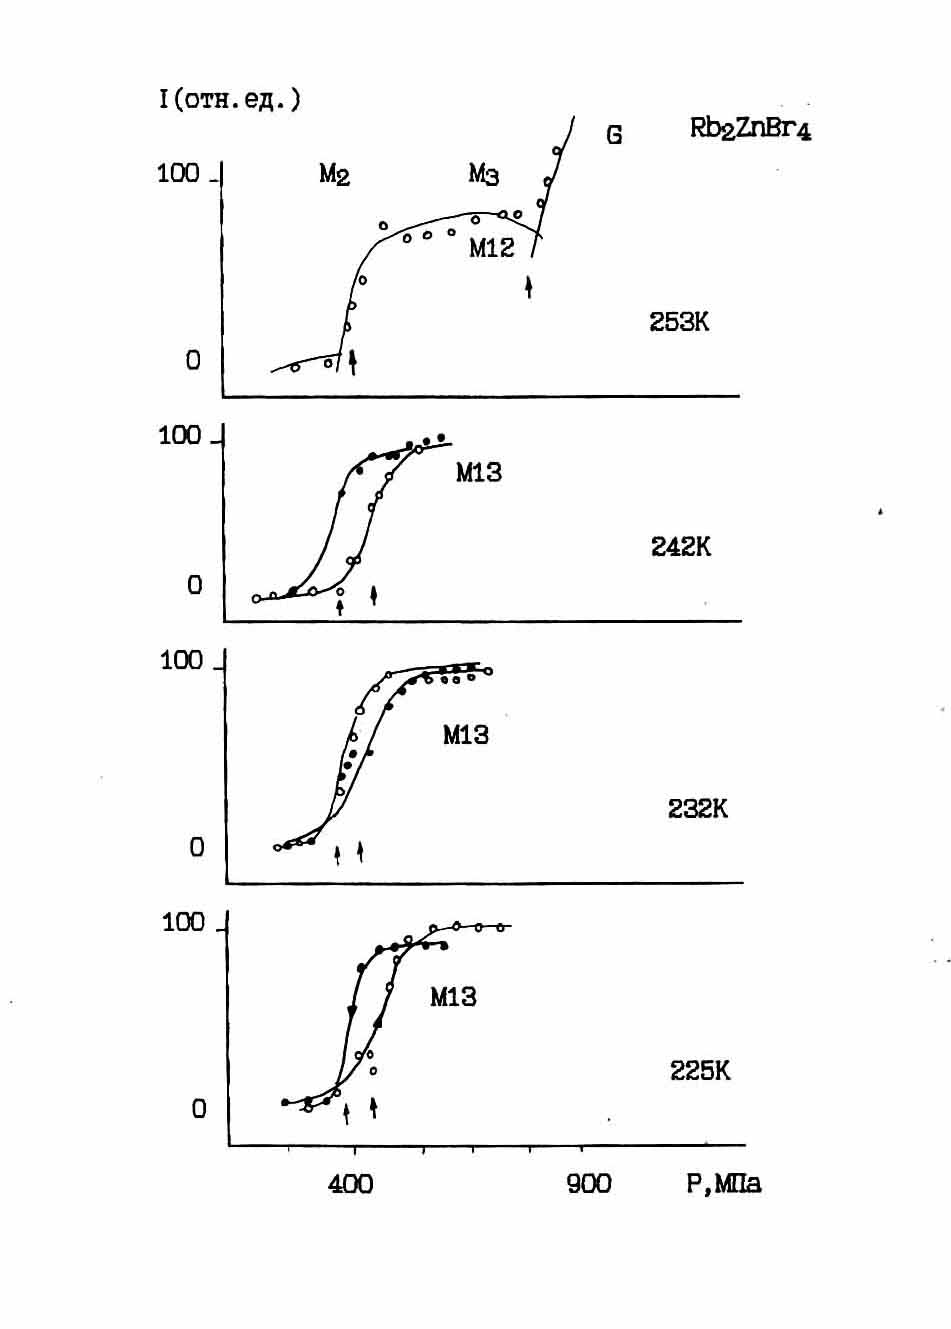
Fig.4.22. Baric of the intensity of spectral lines M13 (M12) in the phase transition M2 ↔ M3 at different temperatures.
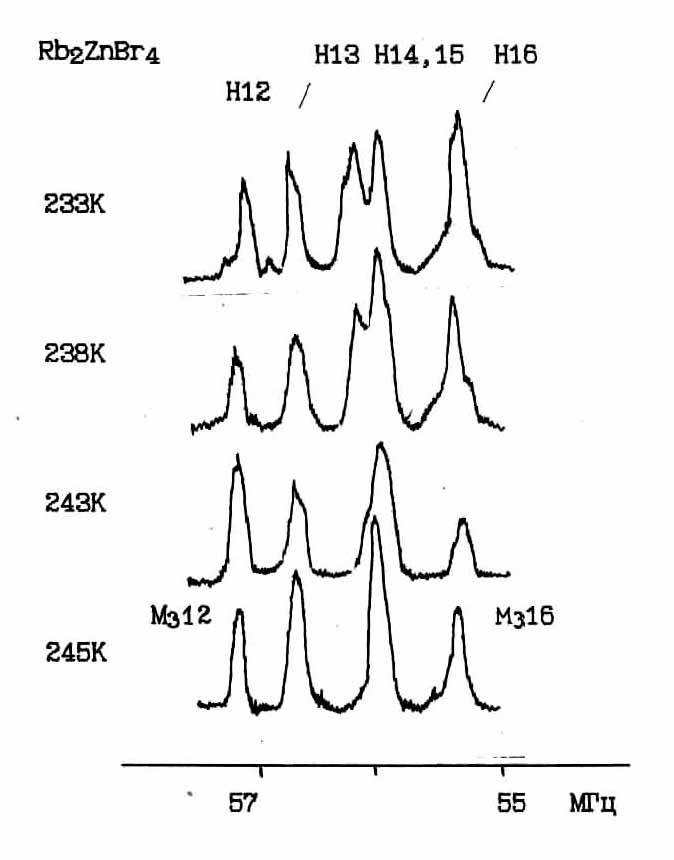
. Fig.4.23. Changing of the NQR spectrum in the phase transition M3 ↔ H at P = 500MPa.
Final step of transforming the structure of Rb2ZnBr4 at high pressure is highly symmetric phase G, which is characterized by four powerful singlet absorption lines NQR radio nucleus BrI, BrII, BrIII and BrIV (Fig.4.18). Phase transition in phase G is a first-order transition, because, although no hysteresis phenomena (up 5MPa), there is a region of coexistence of phases. End increases with increasing temperature, and this transition is independent of the direction of change of P-T parameters.
Measurements at pressures above the transition to the 6 were not conducted.
P-T phase diagram of Rb2ZnBr4 - On Fig.4.24 shows the experimental P-T phase diagram rubidium tetra zinc bromine in the 160-3000K at pressures up to 1.0 GPa, built on the results of our data. In addition to the well-studied at atmospheric pressure paraelectric (P), incommensurate (Jc) and ferroelectric (F) phases, it was discovered or suspected the existence of several phases with different structures and symmetries.
By type and nature of changes NQR spectra investigated P-T range can be divided into two areas: 1) the area where the spectrum consists of a small number of intense singlet lines (phase F, G, F and H) and the structure of the phases described by one of the space groups simorfnyh; 2) The second area where the species and the evolution of the spectrum can be associated with the existence of more or less disordered structures (phase N, M and Jc).
Para-electric and the ferroelectric phase are known as spatial symmetry D216h (Pnma), and C29V (P21/n), respectively. With this in mind, using the symmetry transformation rules involving data from NQR, we can show that the phase of H must have a rhombic or monoclinic symmetry. Availability 14 NQR lines, two of which have double the intensity allows unequivocally enough to suggest that this phase is described by the point group symmetry P21 quadruple unit cell volume (V = 4, Z = 16). Highly symmetric phase G, which is characterized by four nonequivalent positions in structure Br nucleus may have a monoclinic or triclinic symmetry with unit relative to the paraelectric phase, the unit cell volume (V = l).
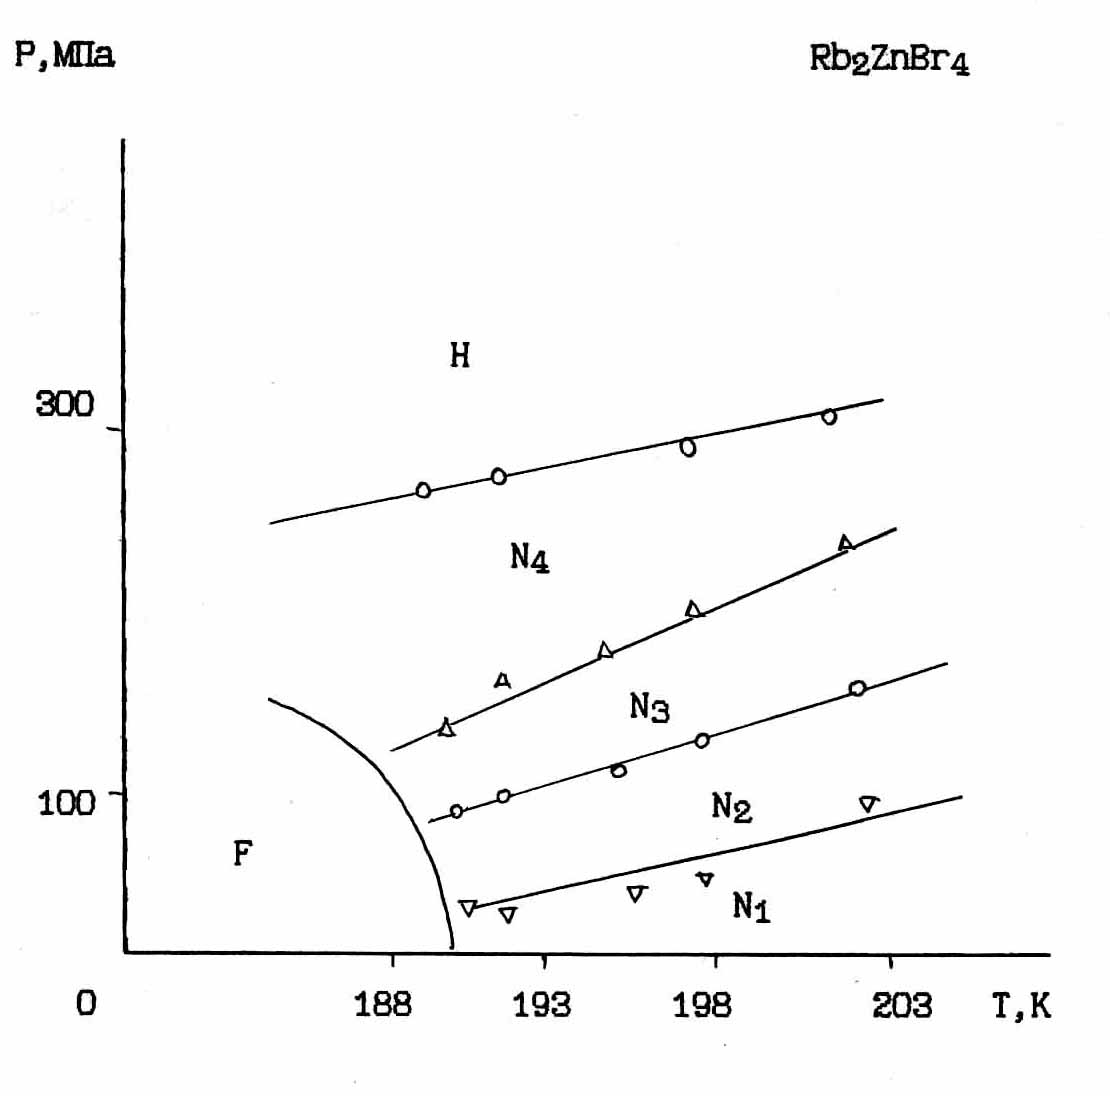
Fig. 4.24. Phase diagram of Rb2ZnBr4, obtained by NQR.
The latter assumption is supported by extensive, approximately 4-fold, increase in the integral intensity of each of the four NQR lines. Reduction of vernix with increasing pressure and temperature indicating the approach to a particular T-P point in the phase diagram. It also indicates the position of the P-T phase line separating Jc and P and P-Jc blur transition with increasing pressure. Based on this and several other reasons, we assumed the existence of the Lifshitz point, which should be located at the intersection of P-T lines separating highly symmetric phase G and P (Ris.4.35).
Region of existence of the disordered structure can also be divided into three parts:
1) low-temperature region N, where there is a well-defined frequency resolution and intense spectral components or groups. In this area, we can assume (with) the existence of long-period nearly commensurate structures;
2) P-T region Jc, where there are blurred spectral shape characteristic of the incommensurate phase (disordered structure of long-period);
3) Field of phases M where NQR spectra have more or less frequency resolution basis. The degree of ordering of the structure is increased when approaching the phase transitions in lines H and G phase. Reduce the blurring and hysteresis transitions between phases M1, M2, M3 with increasing pressure, also indicates the nature of the structural transformations.
As in most of incommensurate phases dielectrics family A2BX4 and in compounds with CDW [63,96] hysteresis phenomena are global in nature, and there is a large range of variation of hysteresis phenomena in different surroundings investigated P-T region, from 20 to 160MPa.
Note also feature observed in passing phase transitions F↔ N↔H for different directions of change of P-T parameters (Chapter 4 § 2). This behavior indicates a specific data type conversions, due to the presence of significant non-equilibrium phenomena. Registers significant blurring if the transition phase as it passes along the line, compared with the transverse passage. This is apparently due to a clearer and observation of phase transitions isothermal scan compared with isobaric.
Thus as a result of these studies failed to establish the following:
1) With increasing hydrostatic pressure P-T transition is shifted to higher temperatures;
2) At pressures above 250MPa and temperatures below 2200K observed commensurate phase H presumably rhombic symmetry P21 and quadruple volume;
3) Has a highly symmetrical above 500MPa phase G, with the same, relative to the paraelectric phase, the unit cell volume (V = 1) ;
4) Low-temperature region of the existence of an incommensurate phase increases with increasing pressure up to 250MPa, phase transitions F ↔ N, N ↔ H in isobaric mode significantly eroded;
5) Close TC observed a special P-T area, increases with increasing pressure and is characterized by the coexistence of different groups of spectral lines;
6) In the middle region of the incommensurate phase in zoom mode pressure observed sequence of phase transitions Jc→ M1→ M2 → M3 → G, Apparent to transform NQR spectra.
Almost simultaneously with our studies were performed measuring the dielectric constant of RZB at different pressures [59]. Although this method is less sensitive than the NQR method, the author managed to watch some anomalies. Position of the phase transition points, tracked in this study was determined from the temperature dependence of the maxima e (T,P), which in most cases were observed strongly blurred.
Comparison of the phase diagram Gezi (Fig.4.11) with our data shows that in the pressure 250MPa near TC, where we tracked a special area of the phase diagram, the triple point (see details in § 4.3), by e-measurements also assumes the existence of a triple point. There is a clear coincidence P-T lines between II (Jc) and V phases Gezi and P-T line Р3+ (M2↔M3 ) tracked in this study. However, other data show significant differences. First, there is no phase transition line between phases G ↔ H, ↔ M ↔ N and I ↔ M1 ↔ M2 observed using NQR. Secondly there is the P-T phase line separating Jc in at atmospheric pressure (phase II and II' in the notation Gezi). In this case the author notes that the P-T line between phases II'-II and IV-V are fixed and not very clearly in cooling mode only, and e-peak between II(Jo) and IV phases smeared with increasing pressure. Data differences in our opinion due to the following. First, the significant influence of nonequilibrium processes, as we discovered the character structure transformation depends on the direction and rate of change of external influence. Secondly, impurities. Third, the difference polycrystal-monocrystal. It is therefore possible for a shift of the phase transition lines and their degree of fuzziness for samples of different states and crystallization.
Taking these arguments, we can explain the discrepancy between some of the data as follows. The P-T transitions between phases H↔N, I↔M1↔M2 is not recorded in the e-measurements due to their small inclination to the isobaric directions of measurement.
2) Mild line between phases II and II'(Gezi observed in cooling mode only), correlates with the position of P-T line P1 (M1↔Jc ), recorded by us in reducing the pressure mode. The difference in the absolute position PT can be explained along with the above arguments, the difference in the determination of transition criteria.
English abstract § 1.1 § 1.2 §1.3 § 1.4 § 2.1 § 2.2 §2.3 §2.4 § 3.1 § 3.2 § 3.3 § 3.4 § 4.1 § 4.2 § 4.3 § 4.4 Reference Template pdf abstract