SHEMETOV YEVGENY. STUDIES OF PHASE TRANSITIONS IN THE UNITED A2BX4 STRUCTURE β-K2SO4 METHOD NUCLEAR QUADRUPOLE RESONANCE
English abstract § 1.1 § 1.2 §1.3 § 1.4 § 2.1 § 2.2 §2.3 §2.4 § 3.1 § 3.2 § 3.3 § 3.4 § 4.1 § 4.2 § 4.3 § 4.4 Reference Template pdf abstract
§ 1.2 Radiospec research methods disproportionately modulated structures.
Radiospectroscopic research methods substances based on excitation of transitions between energy levels of nuclear spins by the RF field. In the case of crystalline solids RF interaction with nuclear or electron spins in a crystal field representation atoms in the form of:
H = Ho + H1 + .. (1.6)
where Ho is about - the interaction Hamiltonian of the spin of an electron-nuclear environment of crystal atoms
H1 - interaction of the RF field.
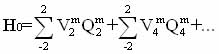
In general terms, in connection with the usual symmetry of the nuclear wave functions, crystal-field Hamiltonian H atoms can be represented by a series expansion in even powers of the spin moments [19,24]:
 (1.7)
(1.7)
where Qi - operators associated with the projection of the spin operators; Vim, - coefficients, expressed in terms of parameters inside and interatomic interactions. Symmetry of these factors, in particular, depends on the symmetry of the crystal lattice and the phase transition is mainly determined by the symmetry of the soft mode.
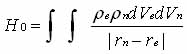
In the case of nuclear quadrupole resonance (NQR) the interaction of spherically asymmetric nucleus of an atom with an inhomogeneous electric field electron environment. Coulomb energy of this interaction is given by [25]:
 (1.8)
(1.8)
where r e and r n - density of electron and nuclear weapons;
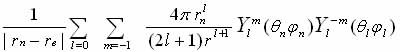
rn-re - distance between the interacting charge volume dVе dVn . Using the decomposition
 (1.9)
(1.9)
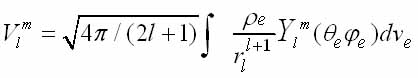
in spherical and radial functions and introducing the notation Vi for the l-th term in the expansion potential of the dipole moments of the electron nucleus
 (l.10)
and passing to the operators, we obtain the interaction Hamiltonian nuclear electric moment with the atomic electrons in the form (1.7). Nuclear quadrupole interaction is described by the term
 (1.11)
where, as is well known [24], the operators Q2m expressed in terms of the operators of the nuclear spin I, Iz, I-, I+, and the components of V2m through komponty EFG tensor qab:
 (1.12)
In the simplest approximation is considered point-charge model, oscillating near the sites of the crystal lattice ri.
 (1.13)
 (1.14)
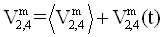
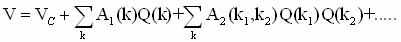
Returned to the expression (1.7), we see that the coefficients of V2m,4 are determined, in particular the nature of the atomic displacements in the crystal and in the general case can be presented through static and dynamic displacements of these
V = Vc + A1Q + A2Q2 + . (1.15)
In highly phase most of V2m, 4 is zero. In the distorted phase one (or more) of the coefficients Perfect Branch becomes zero and can be expanded in powers of order parameter Q =u.
Taking into account the fluctuations of Q, above Ti:
 (1.16)
For the EFG tensor tensor this expansion into more formal recording renaming symbols represented in the form [19,27]: at T> Ti
<Vij>=Vij(0)+Ak2<Qc(k,t)>+... (1.17)
at T> Ti
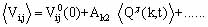
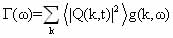
Where Q(qs-k,t)= áQ(qs-k,t )ñ + dQ(qs-k,t ) - static and the fluctuation of the order parameter near the dew point of the soft mode qs. The spectral function of a critical variable Q (k, t) has the form [19]:
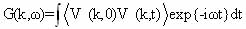 (1.18)
under decomposition and Vij (k, t) may be represented as
(1.19)
where V (k, O) V (k, t) is divided into static and temporal parts. If the time-dependent part of v (k, t) is a slowly varying function of time, for the wave vector q s component of the spectral response function
![]() (1.20)
(1.20)
q s , ( ):with contributions by close to q s, the line shape will be (taking into account the first term of the expansion)
 (1.21)
thus the line shape reflects the shape of the distribution function of the atomic configuration of distortion caused by movement in slow-time radio. Linewidth characterizes while the rms value of the contributions to the distortion caused by the Fourier components of the displacement field with frequencies small compared to the reciprocal of the time threshold permits radio (1/T*Q.). If the low-temperature phase is observed any preferential swings from a position displaced by an amount ± Q0(T)from the position of a highly, the line will consist of two components.
When T®Ti Q0®0 and splitting becomes small in comparison with (slow) fluctuations subtransient ordering. In the case of atom spectral line narrows to a minimum when the upper limit of the transition ordering. When a Q linear terms are comparable in magnitude with quadratic, it is necessary to take into account the contribution of the relaxation processes in the Raman linewidth. Finally it should be noted that the lineshape Г(w) is determined by all phonon wave vectors k . In view of this, it is necessary to analyze the results to have any model representation for g(k, w).
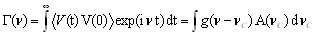
Expression (1.17) for the transformation of the EFG tensor near the phase transition indicates that studies of radiospectroscopic can extract information about the behavior of the order parameter Q (Qs-k, t).
Already at T> Ti measurements enable us to estimate <Q(t)> temporarily averaged square of the critical coordinates, which in the pre-transition region is associated with the critical dynamics. In particular, this refers to the crystals, where the phase transition is associated with an increase in the amplitude of the fluctuations caused by lattice vibrations or librational modes. Time-dependent part of the GEF determined by the speed and the type of processes with which the spin-lattice system can exchange energy.
Therefore, as follows from (1.17), can be studied microscopic dynamics of critical fluctuations, ie T i . amount of change in the fluctuations of the order parameter near Ti.
From the standpoint of radiospectroscopy question is how to properly excite the spin system and measure the spin-lattice relaxation time, to separate the various contributions and then link the measured values with the dynamics of critical fluctuations. HIn the case of nuclear NQR excitation system is an alternating magnetic field H1. : Hamiltonian describing the RF exposure to the system of nuclear spins in the case of continuous sensing has the form:
H1= 2γhI H1сos2pnt (1.22)
where n - frequency of the RF field, γ - gyromagnetic ratio.
The transition probability per unit time between the states cк and c1 in this case is given by [30,135]:
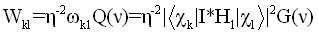 (1.23)
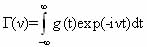
Wk1 –relative transition probabilities, G(n) - a function of the spectral distribution of the resonance line. Absorption intensity under resonant excitation depends on the difference in population levels and, in the absence of saturation, the expression [26,29]:
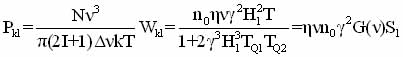 (1.24)
N-number of nucleus , Dn - half-width of the absorption line.
Under pulsed excitation quantum spin system operators depend on time and to calculate the amplitude of transient signals commonly used density-matrix method [30]. In this case the change of the static density operator s is described by Neumann
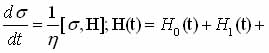 (1.25)
H0(t) - the operator of the quadrupole interaction,
H1(t) - operator interaction with the RF field H1 cosnt. The last operator is zero between pulses. Equation is represented as [31,135] s = R-1s0R where R=RIRtRIIRt+t. RI and RII solving the Schrodinger equation for the period RtRtt action pulses (intervals nutation) ; Rt and Rtt -for free precession intervals between pulses
Developed methods for the solution of equation (1.25) allow us to calculate the amplitude of the signal induction At, At+t and spin echo At+t with a two-pulse excitation of nucleus with spin 3/2 [32]. Spin echo envelope, as shown, may be represented by two terms - term proportional to the magnitude of the constant component and a corresponding member of the induction signal, which is small if T*Q2 < t < TQ2 (TQ2«T*Q2). Study of spectral functions transient signals are not known. However, under certain spectral conditions, and in particular cases, referring to the direct comparison, it is reasonable to select those conditions of pulsed excitation, when the spectral shape of the resonant response is comparable to form a continuous sounding excited.
Referring to the description of known femenologicheskoy model static and dynamic characteristics incommensurate phases [33,34].In the adiabatic approximation of the resonance line shape is described by the expression [27]
 (1.26) Where
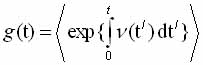
that looks like a static redistribution
; (1.27)
If we assume that at the phase transition, the frequency of the resonance absorption of the nucleus can be expanded in powers of the displacements
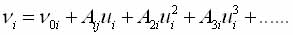 (1.28)
where ui can be represented as an expansion in the eigenvectors of the soft mode (1.1), for each atom p varieties can write (nonlocal description) [35]:
![]() uip= ucOp cos((xi)) + usop sin((xi)) (1.29)
uip= ucOp cos((xi)) + usop sin((xi)) (1.29)
where the plane-wave approximation modulation (PWA), the phase changes of the atomic displacements as:
φ(х) = qsxp + φОp(х); (1.30)
and in the soliton approximation:
![]()
(1.31)
If the modulation long periodic then
After substituting (29) into (28) we obtain
 n(X)= no + n1COS(y(x)+j) + n'2 + n2OS2y(x)+... (1.32)
f(n) [33] : according to [33] will be determined by the expression:
![]() (1.33)
(1.33)
Where are N - the number of nucleus per unit length in the direction of the incommensurate modulation. In the case of long-period of modulation f(n) represents the sum of the discrete frequency components of each unit cell unit .
The specific form of the expansion is determined by the local crystal symmetry and lattice site for which the expansion is made, namely, the symmetry of the electronic environment and the symmetry of the eigenvectors of the soft mode. This imposes restrictions on the type of decomposition (1.28), and some of the coefficients Aki may be zero (A10, A2=0 - linear expansion, A1=0, A20 - quadratic expansion, etc.).
Analysis of the function f(n) was carried out for all sorts of occasions decomposition n(x). First results were obtained under the assumption that the resonance frequency no1 working nucleus depends only on the in-phase shifting him atoms (local description) [34]. For
f(n) n(T)
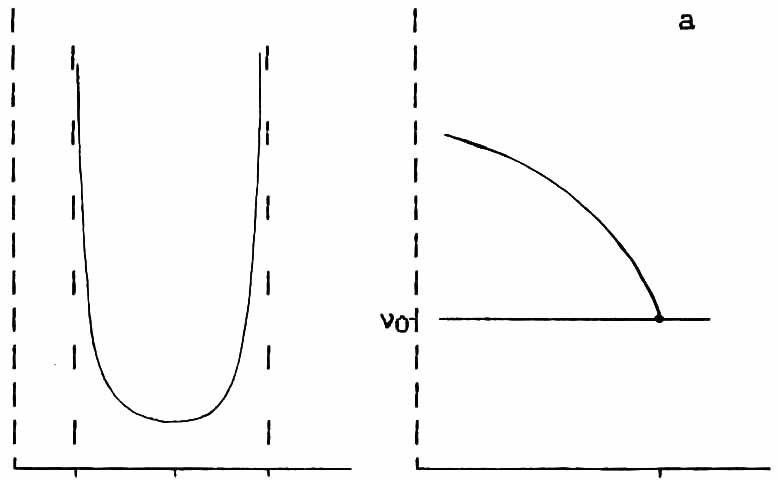
+++++++++++++++++++++++++++++++++++++++++++++++++
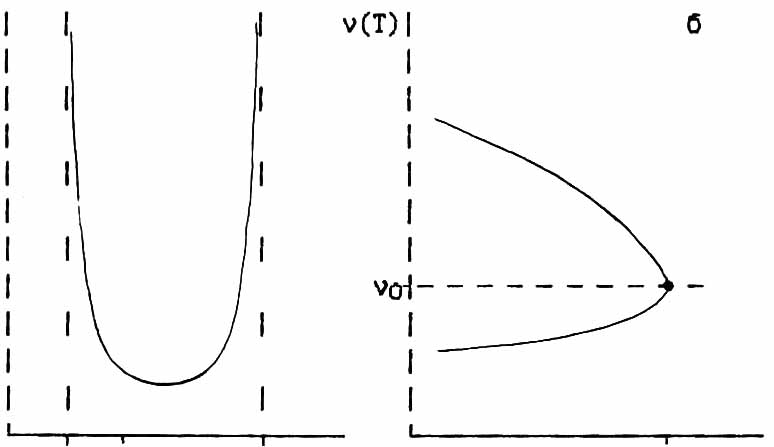
Fig.1.3. Type function f(n) and when disconnection of frequencies in Ti a) local and b) nonlocal cases.
illustration, Figure 1.3 shows a view of functions f(n) and thermal splitting of boundary singularities on the situation for high-symmetry phase in the case of a quadratic approximation PVM. [35].
Later, it was considered femenologicheski impact on GEO Dunn nucleus atomic displacements of the nearby environment associated with other eigenvectors of the soft mode (nonlocal description) [35]. In this case it was possible to achieve greater agreement with experiment. From a theoretical point of view and questions analyzed the spin-lattice relaxation of nucleus in incommensurate systems [33,35].
Thus there is a theoretical basis for the description of the resonance spectra in neoorazmerennyh systems, both static and dynamic aspects. Experimental research objective is to obtain data for comparison.
English abstract § 1.1 § 1.2 §1.3 § 1.4 § 2.1 § 2.2 §2.3 §2.4 § 3.1 § 3.2 § 3.3 § 3.4 § 4.1 § 4.2 § 4.3 § 4.4 Reference Template pdf abstract