SHEMETOV YEVGENY. STUDIES OF PHASE TRANSITIONS IN THE UNITED A2BX4 STRUCTURE β-K2SO4 METHOD NUCLEAR QUADRUPOLE RESONANCE
English abstract § 1.1 § 1.2 §1.3 § 1.4 § 2.1 § 2.2 §2.3 §2.4 § 3.1 § 3.2 § 3.3 § 3.4 § 4.1 § 4.2 § 4.3 § 4.4 Reference Template pdf abstract
Chapter 2. Equipment and measurement technique.
§ 2.1. Receiver sensitivity sensor NQR and conditions optimum adaptation to the measuring chamber.
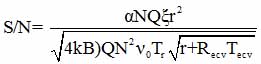
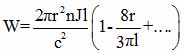
As is known, the sensitivity of the receiving path to radio spectrometer NQR absorption signals defined set of parameters [27]. Thus, according to the survey [64], S / N ratio of the signal to noise ratio at the receiver output can be represented as:
 (2.1)
(2.1)
where α - nuclear spin contribution, N and r - the number of turns and the radius of the solenoid, Q - Q-factor of the receiver coil, B - receiver bandwidth, Tc - temperature of the resonator, ξ - the filling factor of the resonator, Req Teq - equivalent resistance and temperature receiver, νo - quadrupole resonance frequency.
In this section we will carry out examination of the conditions that must be considered when designing NQR cameras to increase the quality factor of the receiving circuit. As is known, this value is limited by the condition Q <1,5νoτim where τim - lifetime free induction signal. In NQR typically Q <150. However, the location of the sensor in the NQR shell, which is a body of a device external influence on the sample, the Q value is significantly reduced due impendansnoy sensor communication with the shell of the device. This relationship can be expressed as follows [65]:
 (2.2)
(2.2)
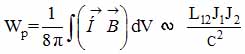
where W - energy stored in the resonator, P-power loss associated in particular with the dissipation of energy in the environment of the resonator. To calculate the losses it is necessary to estimate the energy W. As we know the energy of interaction between two conductors is expressed through the inductive factor L12
 (2.3)
(2.3)
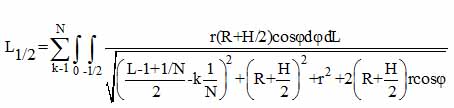
where J - volume currents. In case the interaction of the solenoid (radius r and length l) with a cylindrical shell (radius R, the length L and the thickness H) according to [66] has an analytical expression:
 (2.4)
(2.4)
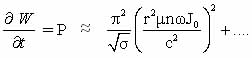
where N - number of coil turns, φ - polar angle. LIntegral in the general case is calculated numerically, but L → ∞ is expressed in terms of elliptic functions. In the frequency range (ωR<c) can be obtained for the magnitude P loss following expression [65]:
 (R>r) (2.5)
where (μ and б - magnetic permeability and conductivity of the shell, and take into account the higher-order bias currents, giving an increasing contribution at ωR = c.
Knowing the energy of a cylindrical solenoid [65]
 (2.6)
(2.6)
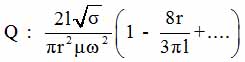
we can evaluate how the cavity Q depends on some dimensional parameters:
 (With R> r) (2.7)
For high frequencies (in this case more than 108Hz) observed other addiction [66,67].
The estimates show, in particular, that the Q value decreases with the increase of the radius r of the solenoid proportional to its square. Midrange in losses will contribute as part of the capacitive impedance of the system.
Returning to the value of the ratio of school, we can see that from the point of view of the geometry of the coil placed in the shell, school increases with the radius and the length of S/N æ r√ 1 . However, the length of the L shell in the real world is always limited and decreasing L - 1 will increase energy leakage near the ends of the solenoid [67]. Therefore, we can assume that when choosing some optimal geometric relationships between the dimensions of the shell and coil, SN ratio can be increased by increasing the radius of the coil. Expression (2.7) is rather illustrative indication to select geometry and material characteristics of external consoles NQR. In our case, this is due to the fact that a large part of the diapason of frequencies used, is in a quasi-stationary region field (ωR ≈ с) (the mids). Therefore, prior to making the designs consoles external influence, we chose the optimal geometry by measuring the quality factor resonators NQR directly on layouts and finished products.
It was established experimentally that SN ratio increases with increasing radius of the receiver of the NQR sensor up to a value which is approximately half the size of the internal outer shell. The magnitude of the energy loss depends on the magnetic and conductive properties of materials. As shown in [68] and it follows from (2.5), a conductive shell for high frequency loss value decreases with increasing the conductivity of the shell. In the case of dielectric shells made loss due to the bias currents, and increase with frequency. The magnitude of dielectric loss is essentially independent of the geometry of the shell.
These principles have been taken into account in the design world and improve termopristavok NQR for research and used in the development and manufacture of high-pressure chamber with increased sensitivity to signals NQR (see § 2.2 and 2.4).
Originally optimal matching method (OM) was tested at check NQR signals from nucleus 37C1 and 35C1 compound K2ZnCl4 with a structure of β-K2SO4. This compound was initially investigated by the NQR spectrometer superregenerativnogo type in a chemistry lab minerals Klaytona sity, Australia, Scaife [44]. At ambient temperature was revealed six signals from nucleus 35C1, in the frequency domain with 8-10MHz ratio S/N = 6--12 units. At liquid nitrogen temperature signals are absent. Later, at the Institute of Materials Attica, NQR in K2ZnCl4 found three
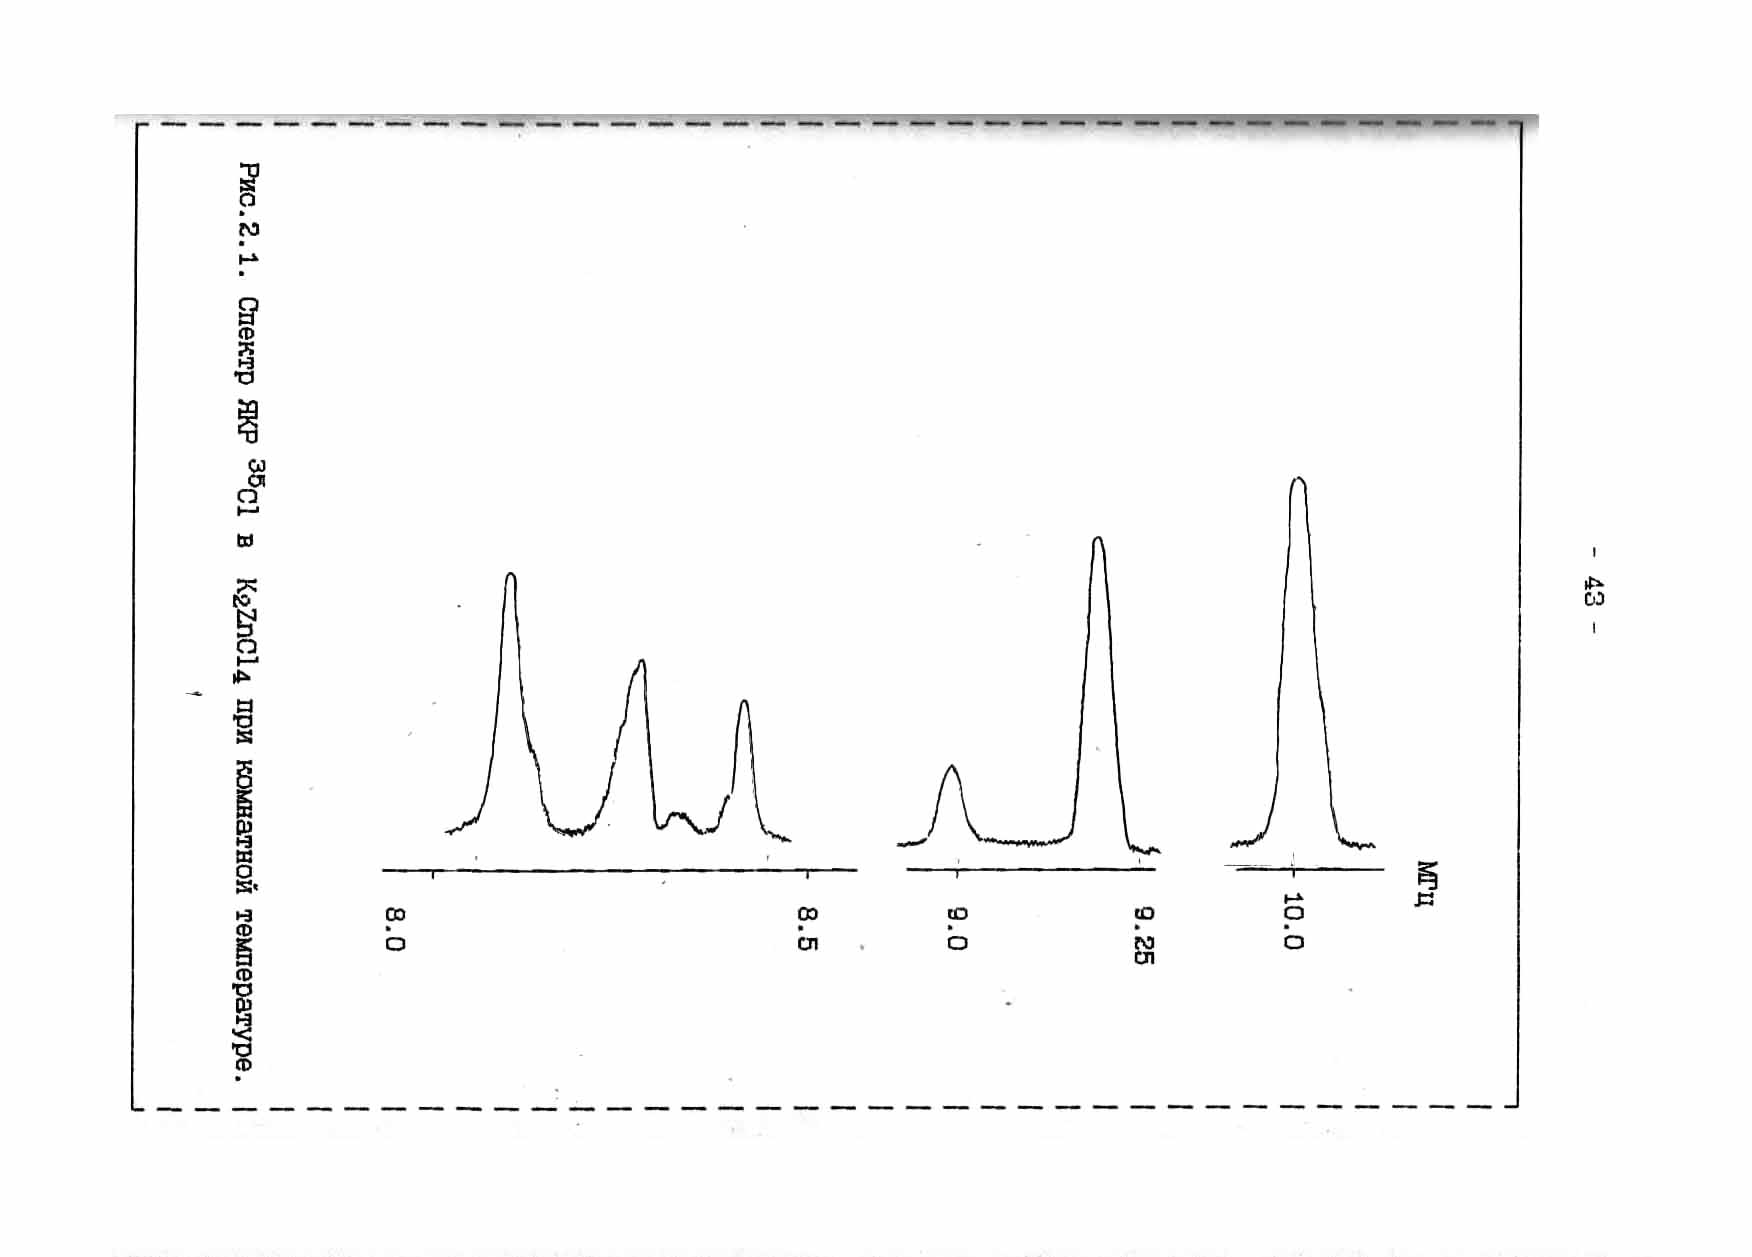
Figure 2.1. NQR spectrum 35C1 in K2ZnCl4 at room temperature
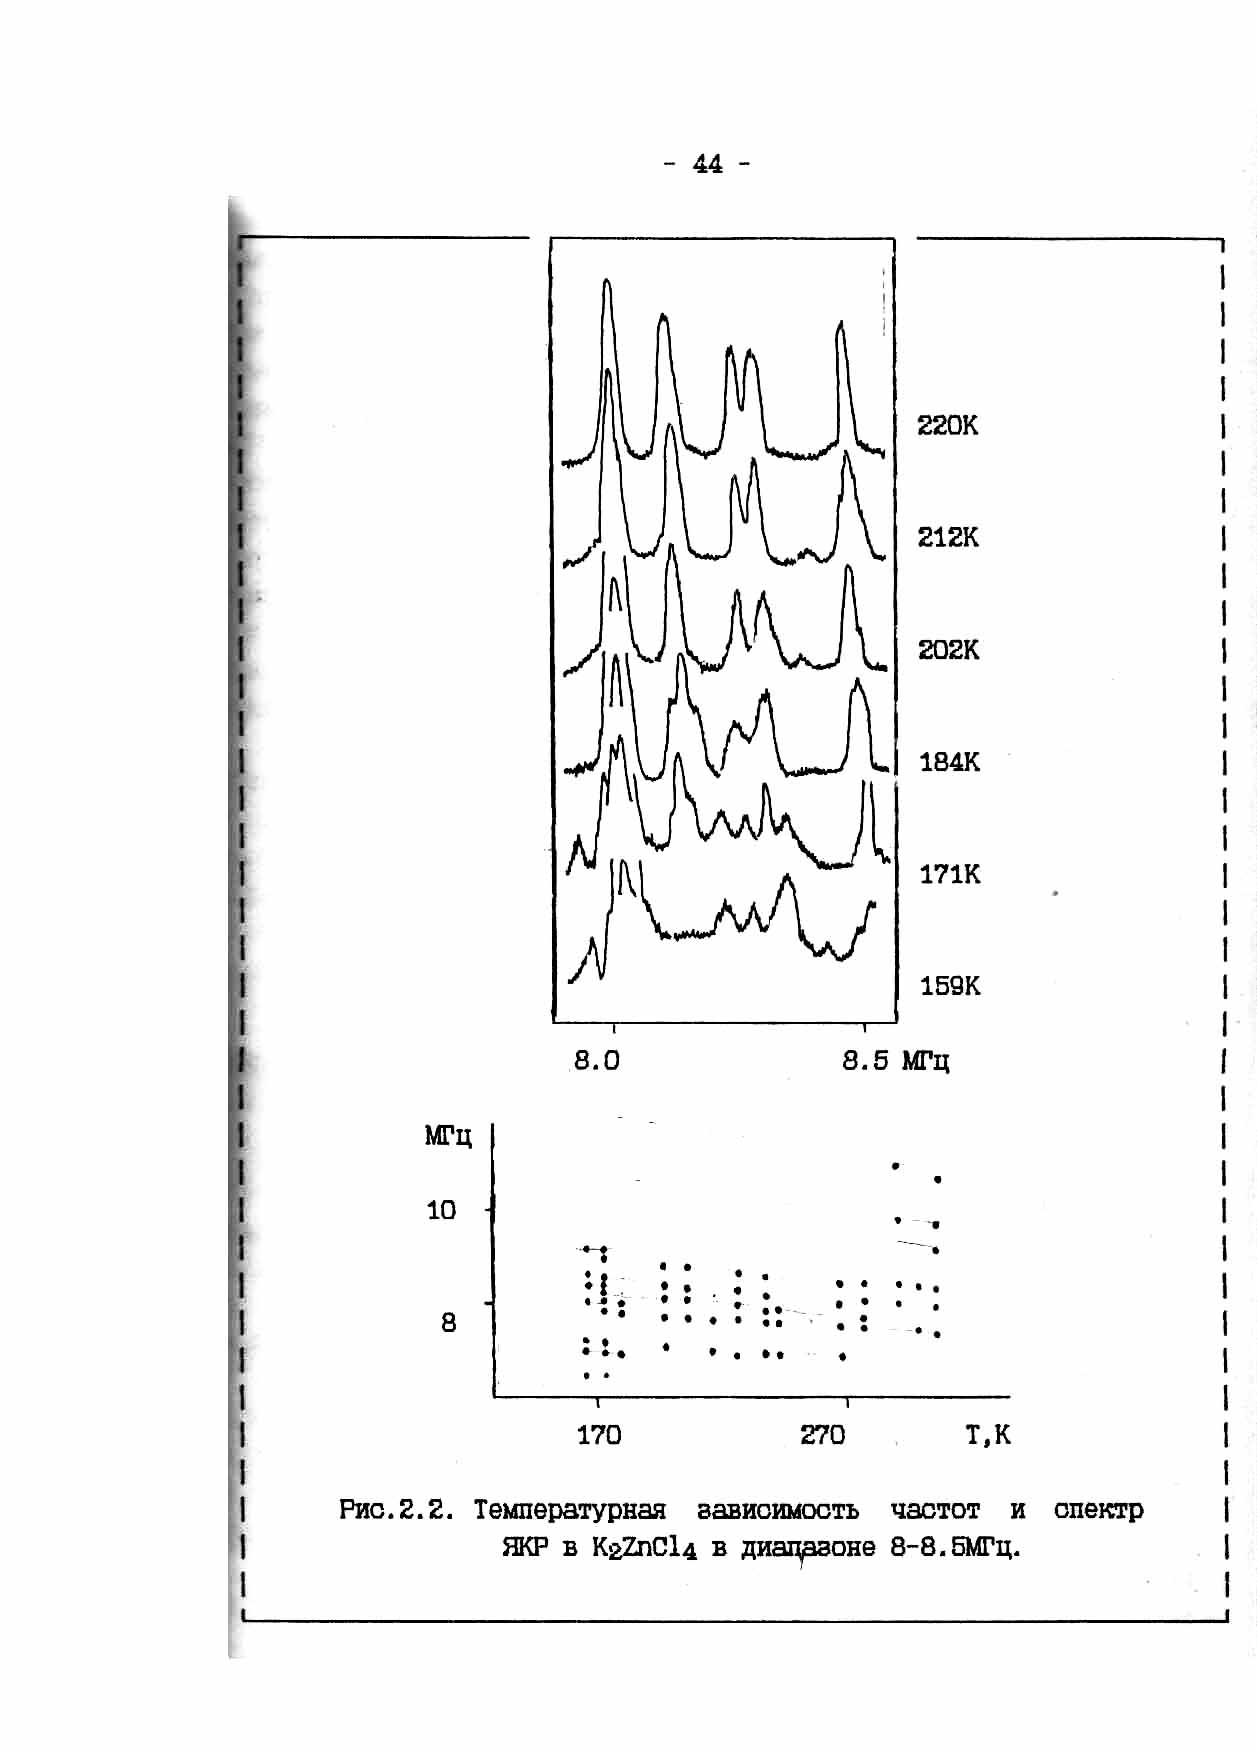
Figure 2.2. The temperature dependence of NQR spectrum and in K2ZnCl4 in the range of 8-8.5 MHz.
phase transition at Ti = 553K, TC1 = 403K and TC2 = 145K [37]. When this was recorded only part of the full spectrum of 35Cl NQR near 560K and below 290K. Signal to noise ratio was in the range 0—12 units. The first attempt to study this connection, we noted only weak NQR signals at liquid nitrogen. Application of the method allowed us to fix the OS full NQR spectrum (Figure 2.1) at room temperature (RT). S/N ratio was 10--25 units. In the frequency range 8,5-8,0 MHz NQR observed spectral lines are not marked in [37]. Fig. 2.2 shows the temperature variation of the NQR spectrum of K2ZnCl4 and the temperature dependence of the frequency ν(T). For high-frequency part of the spectrum at T = 290K, unlike us Milian observed broadened singlet absorption line NQR. At T = 173K observed anomaly associated with the redistribution of intensities and frequencies of the spectrum. Simultaneously with our measurements, different researchers using mutually complementary methods observed phase transition in this temperature range [69,70]. However, some significant variations in the temperature of this transition and reusability of data. IAs explained later, it was the result of significant non-equilibrium processes characteristic of this class of compounds I.
English abstract .pdf download § 1.1 § 1.2 § 2.1 § 2.2 § 3.2.1 § 3.2.2 § 3.3 § 3.4 § 4.1.1 § 4.1.2 § 4.3 § 4. 4 References