SHEMETOV YEVGENY. STUDIES OF PHASE TRANSITIONS IN THE UNITED A2BX4 STRUCTURE β-K2SO4 METHOD NUCLEAR QUADRUPOLE RESONANCE
English abstract § 1.1 § 1.2 §1.3 § 1.4 § 2.1 § 2.2 §2.3 §2.4 § 3.1 § 3.2 § 3.3 § 3.4 § 4.1 § 4.2 § 4.3 § 4.4 Reference Template pdf abstract
§ 3.2 Study the sequence of phase transitions in Cs2ZnJ4 NQR 127J.
Initial data on the study compound Cs2ZnJ4 NQR presented in [45]. Continuous method at room temperature observed three rezonananyh absorption signal from the nucleus of 127 J and only one absorption line at 77. temperature of 77K.
In 1988, the compound Cs2ZnJ4 originally synthesized and studied by NQR author, and then were held and more comprehensive studies [78-82,138].
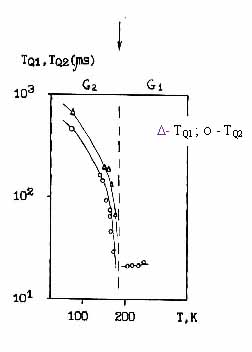
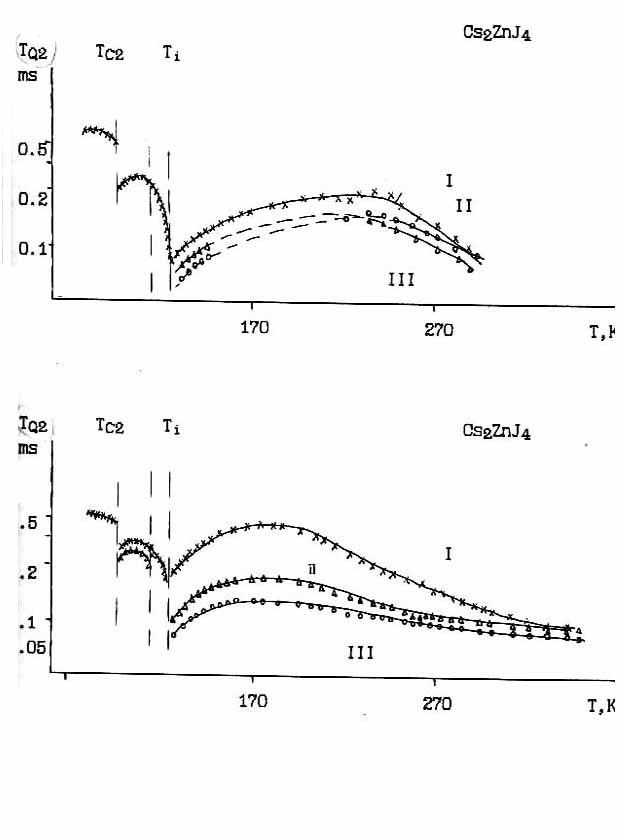
Fig. 3.2. Temperature dependence of the time TQ1 and TQ2 of the quadrupole relaxation of 127J in Cs2ZnJ4 (Δ - TQ1 ; o - TQ2)
Cs2ZnJ4 crystals grown from ZnJ4 aqueous solution at 313K. According to our diffraction studies, at this temperature, the compound has an orthorhombic structure with space group symmetry Pnma-Dah16. NQR spectra were recorded by the optimal matching in gas-liquid heat chamber in the temperature range 77 400 K. At room temperature (RT) at the transition 1/2↔3/2 nucleus 127J observed three absorption lines at the frequencies 8.87; 75,50; 75.50; and 72.75 MHz with an intensity ratio other than the ratio of 1:1:2 (the latter position should reflect symmetry nucleus 127J at positions I, II, III and (III ') structure Pnma). Fixed ratio of intensities and frequencies, but different from that registered by super regenerative NQR [45]. At 77, we observed eight singlet spin-echo signals and three NQR signal decay of free precession (MTP). One of the precession signal whose intensity was greatest, was close to a single frequency signal is observed at TCA [45].
In a wide range from 120 to 4000K the temperature dependence of high-frequency components of the spectrum is linear with dνI/dT = 5,87*10-2; dνII/dν = 1,51*10-2 dνIII/dT = 1,19*10-2 MHz/0K. Below 1200K the temperature dependence of the NQR frequency spectrum and its multiplicity change (Figure 3.3, 3.4). At a temperature Ti = 1180K the first phase transition is observed, which is fixed on the anomalous behavior of the spectra shape Figure 3.4 and 3.5, and the spin-spin TQ2 and the spin-lattice relaxation time TQ1 nucleus iodine Figure 3.7.
As we approach the Ti peak intensity of the lines decreases (Figure 3.6) I have high-frequency component of the spectrum, long before Ti, there is a marked asymmetry of shape. For the other two lines of the spectrum asymmetry is observed at lower temperatures. When passing the phase transition diminishes the intensity of lines in the field of asymmetric wing, a new spectral component. The change in the spectrum can be interpreted and register as the existence of three
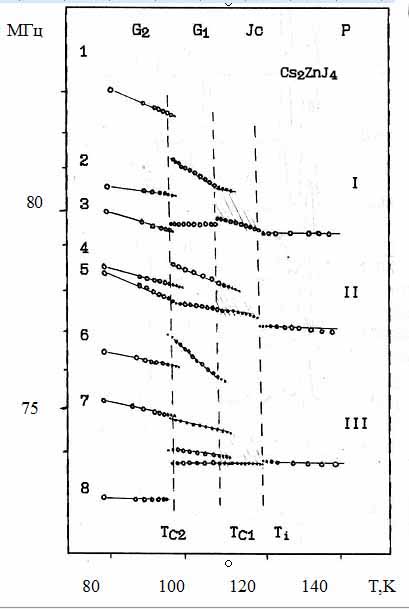
Fig. 3.3. The temperature dependence of the NQR frequencies in the 127J in Cs2ZnJ4
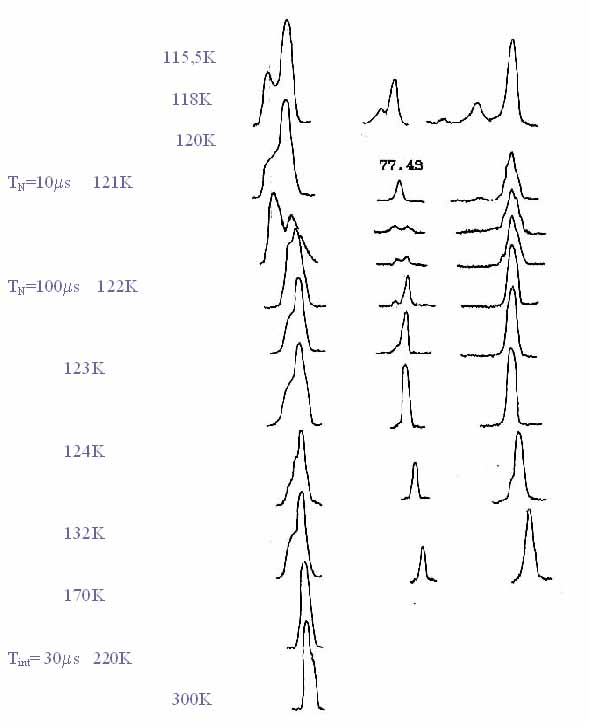
Figure 3.4. Type 127J NQR spectrum of Cs2ZnJ4 near Ti
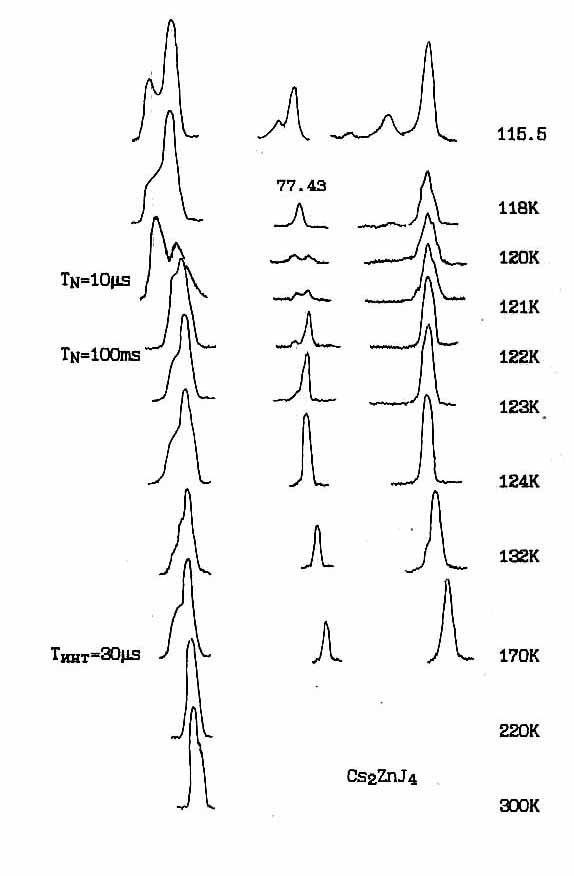
Figure 3.4. Type 127J NQR spectrum of Cs2ZnJ4 near Ti
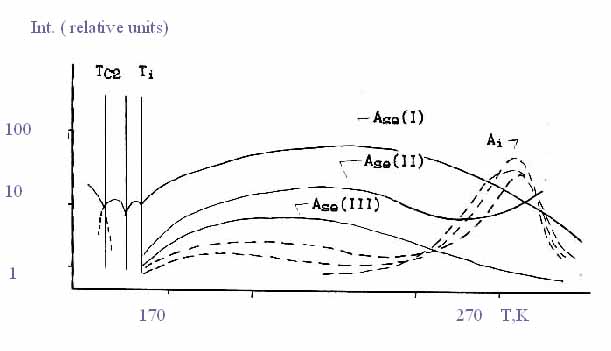
Figure 3.6. Changing the signal amplitude of the spin-echo (Ase ) and induction (Ai ) on the temperature at some parameters of the pulse setting. (Cs2ZnJ4 )
TQ1 (ms) Cs2ZnJ4
TQ2 (ms) Cs2ZnJ4
Fig.3.7. Temperature dependence of the time TQ1 and TQ2 cpinovoy relaxation in Cs2ZnJ4
closely spaced components whose frequencies are continuously follow through Ti. Below 1180K spectrum shape is typical for the incommensurate phase (Figure 3.5). It should be noted that the optimal matching method for the first time were able to observe the full range of NQR in incommensurate phase tsezevogo compound (Cs2BX4) with iskhodnoi structure Pnma. The advantage of the optimal matching can be demonstrated by comparison with similar measurements [87,88], where Ti near signals are not observed. The hysteresis transition at Ti, the peak intensity changes along lines I, I and III, no.
Although continuum frequency distribution, limited terminal peaks typical of the NQR spectrum of the incommensurate phase in the temperature dependence of the line shape, there are significant deviation from existing models [34]. Directly below Ti less intensity "singularity" of the spectrum is very blurred and far from the form predicted by the model. However, with decreasing temperature, shrinks to a spectrum intensity corresponding to a peak that becomes pronounced in the middle well disproportionate phase. Line III below Ti is split into two strongly overlapped continual distribution, one of which is weaker in intensity. High-frequency part of this distribution appears above the noise level only in the middle temperature range nesoraamernoy phase.
As the temperature decreases, the sharp change in intensities (Figure 3.6), and notes the jump frequencies, at least the line at frequency 80MHz, tilting frequency dependencies, well fixed phase transition Jc↔G1 at TC1 =108K. This behavior is also not consistent with the model [34], where the frequency of boundary singularities continuously converted into singlet line low-temperature phase. In the G1 phase, we observed eight ravnointensivnyh NQR lines. Hysteresis transition at TC1 about 3K. In addition to the continuing progress of the frequency spectrum of the line III in the G1 phase at temperatures of 96-1050K at a frequency of 73.6 MHz observed Intense induction signal that accompanies the bass line NQR in this phase, fixed by the spin-echo signal. According to our data here, as in Rb2ZnBr4 observed cross-relaxation resonant excitation of a certain level of connectivity Cs2ZnJ4 within the contour line of the low-frequency phase G1.
At 960K observed a pronounced phase transition G1 ↔G2. with the number of lines in the spectrum does not change, change their frequency. Observed phase coexistence. Hysteresis transition is absent. Coexistence region depends on the quality of the samples and for the more perfect crystals is ≈20K .
Temperature dependence of time and TQ1 and TQ1, measured by the resonant response of the absorption of iodine nuclei in positions I and III of the crystal structure of tetra cesium iodine zincate indicates existence of a critical slowing down at T → Ti. In this case directly with Ti, due to approximating the values of the relaxation time to the limit of time resolution of the spectrometer (≈30-20ms for TQ2 and ≈100ms for TQ1) measurements were performed with low accuracy.
Near TC2, also observed critical slowing down prior to the jump relaxation times at first-order transition.
At temperatures above Ti NQR signals consist of heterogeneous as well as from homogeneous component. At the same amplitude value the contribution of these signals igmenyaetsya with temperature (Fig. 3.6). Below 2730K is most clearly expressed spin echo reply nucleus and above this temperature observed area where in the equipment range temporal resolution prevails uniform contribution fixed by the decay of the free precession. There is a slight frequency shift (≈ 50 kHz) between the longitudinal and transverse components of the nuclear absorption. These data indicate a significant spin-relaxation properties of the system. In the available time scale, we performed measurements only time TQ1L and TQ2L (Figure 3.7). As can be seen from the figure, clearly a decrease in TQ1L and TQ2L positions of the nucleus in the structure I Cs2ZnJ4, whereas nucleus positions II and III (III') the spin-spin relaxation in a wide temperature range varies only slightly.
Note that in the Cs2ZnJ4 according NQR no polymorphism and expression of non-equilibrium phenomena. However, at a frequency of 83.3 MHz, by induction, we observed an unidentified NQR signal. Temperature dependence of the frequency of this signal is linear in the temperature range from 300 to TKA, with a small value ∂n/∂T ≈0,85 kHz/0K . Signal amplitude during cooling-heating cycle varies as shown in Figure 3.8. In the cooled signal value increases rapidly approaching the Ti. When the sample is heated in a wide temperature range, a more smooth- .change.
Amplitude (relative units)
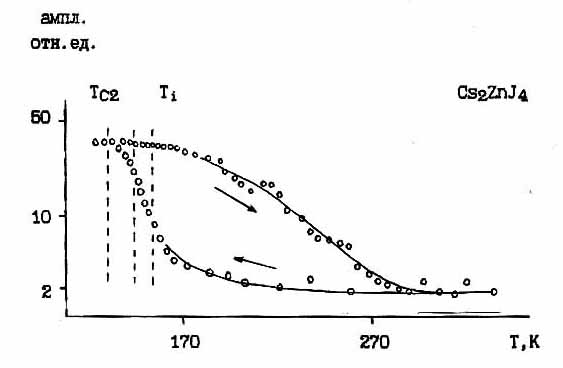
Figure 3.8. Temeraturny stroke amplitude of the signal decay of the free precession frequency 83.3 MHz.
As is well known and customary for all the compounds of structure β-K2SO4, the phase transition in the paraelectric willows Jc phase transition is of the second kind, but for Cs2ZnJ4 observed phase coexistence region near the transition point Ti, which usually characterizes the transition as original. On the other hand, the original transition should be observed temperature hysteresis width of the order of the phase coexistence region. However, from our data suggest that hysteresis effects are fixed only by the homogeneous unidentified NQR signal (Figure 3.8). According to this we can assume that in the Cs2ZnJ4 (see below and also Rb2ZnBr4), there is a microscopic substructure affecting the nature of the phase transition, and hysteresis of the main structure is masked by a large temperature region of frequency overlap of homogeneous and inhomogeneous contributions to the signal NQR. Microscopic nature of observed substructure is confirmed by the presence of trivets cross-relaxation absorption of one of its levels with the level of the basic structure of the NQR frequency 73.7 MHz.. Thus there is reason to assume that the phase transition to the incommensurate phase is smeared in a 1000K above Ti. Around the same area observed asymmetry of the line shape NQR redistribution contributions homogeneous and heterogeneous components NQR signal plateau in the temperature dependence of the spin - lattice relaxation, strong anisotropic scattering by point radiographs. At a temperature change in the slope 2800K measured temperature variation electro-piezo-optical coefficients dDn1 and dDn2 [78], the softening of the optical mode [89]. Thus, in this temperature range is marked with non-standard behavior of macroscopically and microscopically smooth blurred anomaly at 240-270K. Anomaly is associated with a slight restructuring and is accompanied by changes in the spin dynamics of the system.
To describe the observed behavior of the NQR spectral parameters we performed additional NQR study. It turned out that the form of induction decay signals at frequencies of I, II and III is at least two-exponential (Fig.3.9), wherein it is not connected to the interlevel spin transitions of 5/2. This indicates the existence of two systems in the dynamics of the scale of the spin-lattice relaxation time - short TQ1s and long TQ1sL.
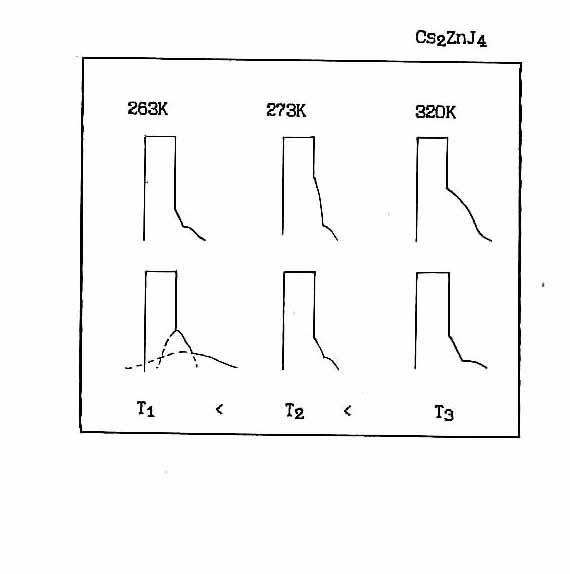
Fig. 3.9. Two-exponential decay envelope shape of the free precession.
With increasing temperature, the shape of the envelope of the induction signal is clearly observed redistribution of these deposits. The existence of two time scales fixed and spin-echo sequence. Line shape at different setting conditions (Figure 3.5) revealed that the frequency dependence of the complex spectral line I can be represented as shown in Fig.3.10.
Analysis of the spectral data in the NQR Cs2ZnJ4 may be conducted under the assumption that between the high and incommensurate phases of the intermediate region. By lowering the temperature of 330K, where there are narrow homogeneous line (which can be explained by the high mobility of iodine ions [97]), the temperature is lowered NQR line shape is broadened by developing fast motions of the atoms are concentrated in clusters and are in the resulting double-well (configuration) potential. After TCI and TC transition atom selects a specific position so that rotation occurs cooperative ZnJ4 tetrahedra in opposite directions with the equilibrium configuration of positions filled building.
Less clearly described behavior, as will be shown below, is also observed in (NH4)2ZnJ4 and Rb2ZnBr4 (signs: an extensive area of dynamic disorder, the presence of an incommensurate phase, a two-time scale dynamics, the existence of substructure).
Very similar behavior was observed in another type A2BX6 crystals [20].
In addition to the NQR data, we have made and the x-ray diffraction studies dielectric Cs2ZnJ4 at temperatures ranging from 300 to 930K [85]. Dielectric changes along the c axis showed a peak in Ti and fractures TC1 and TC1. These data correspond well to similar measurements Gezi [90], made around the same time. X-ray diffraction, it was found that at room temperature the crystal has a rhombic pseudohexagonal cell D216h with parameters: a = 10.835; b = 8.318; c = 14.440A; c/b = 1/3, Z=4, which allows this compound is sure to carry the structural type -K22SO4. When the sample is cooled from 237 to 1070K view radiographs does not change. At 1070K radiograph well displayed in the
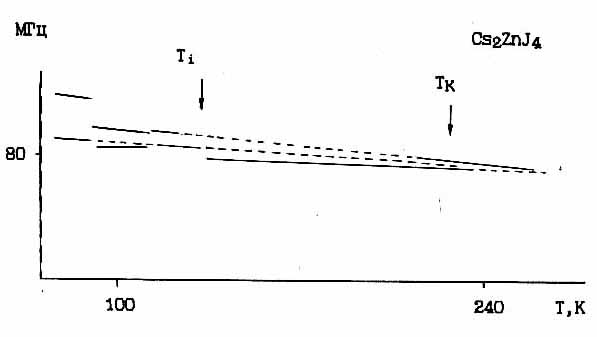
Fig.3.10. Scheme of the temperature dependence of the frequency components of the nonsinglet line (I) Cs2ZnJ4
orthorhombic cell with a = 10,744; b = 8.231; c = 14.341 . At 1080K a splitting of some X-ray line.
Character splitting indicated monoclinic distortion of the cell. By analysis of the extinction reflexes involving elektroopticheokih and NQR data has been proposed that has a Gi phase structure with a spatial group or P21(Z=4) with a polar or nonpolar axis b P21/n(Z=8). Below 950K on X-ray data, has a triclinic cell distortion. General analysis of structural data (including NQR) gives G2 phase space group P1(Z=4).
However, radiographs in Jc phase initially failed to fix superstructure reflections. Only in high-precision X-ray studies performed at the University of Orsay (France) F.Denovue was recorded appearance satellite reflections below Ti, with the value of the wave vector [91]
qδ = ( 1 + δ ) a*/2, d ≈ 0,15 at T = 112.
Thus in conjunction Cs2ZnJ4 discovered and investigated the phase sequence: _
Pnma(Z=4) ↔ Jc, qδ = (1+ δ )a*/2 ↔ P21/n(Z=8) ↔P1(Z=4)
The transition to the incommensurate phase is accompanied by an extensive pre-transition region and the specific evolution of the line shape transition NQR signals.
English abstract § 1.1 § 1.2 §1.3 § 1.4 § 2.1 § 2.2 §2.3 §2.4 § 3.1 § 3.2 § 3.3 § 3.4 § 4.1 § 4.2 § 4.3 § 4.4 Reference Template pdf abstract