SHEMETOV YEVGENY. STUDIES OF PHASE TRANSITIONS IN THE UNITED A2BX4 STRUCTURE β-K2SO4 METHOD NUCLEAR QUADRUPOLE RESONANCE
English abstract § 1.1 § 1.2 §1.3 § 1.4 § 2.1 § 2.2 §2.3 §2.4 § 3.1 § 3.2 § 3.3 § 3.4 § 4.1 § 4.2 § 4.3 § 4.4 Reference Template pdf abstract
§ 4.3 Features conversion spectrum near TC. Comparison with the diffraction data.
. In this section we consider in detail the change NQR spectra in the low temperature region of the incommensurate phase. As noted in § 4.2 in the P-T region of the absorption spectrum is observed, formed by the overlap of different types of spectral lines Fig.4.25, 4.29, 4.32, 4.34.
Plotting changes in peak intensities with the pressure reveals non-monotonic dependence. Presents data on Fig.4.26 typical changes in the intensities of the spectral lines with the majority of the increase in pressure, and Fig.4.27 as an example - baric moves peak intensities of lines N4, N4+, close in frequency to the line F4. . Well tracked fractures in galleries intensities. This behavior confirms the hypothesis based on nonsinglet lines and change their shape due to redistribution of the intensities of the different components.
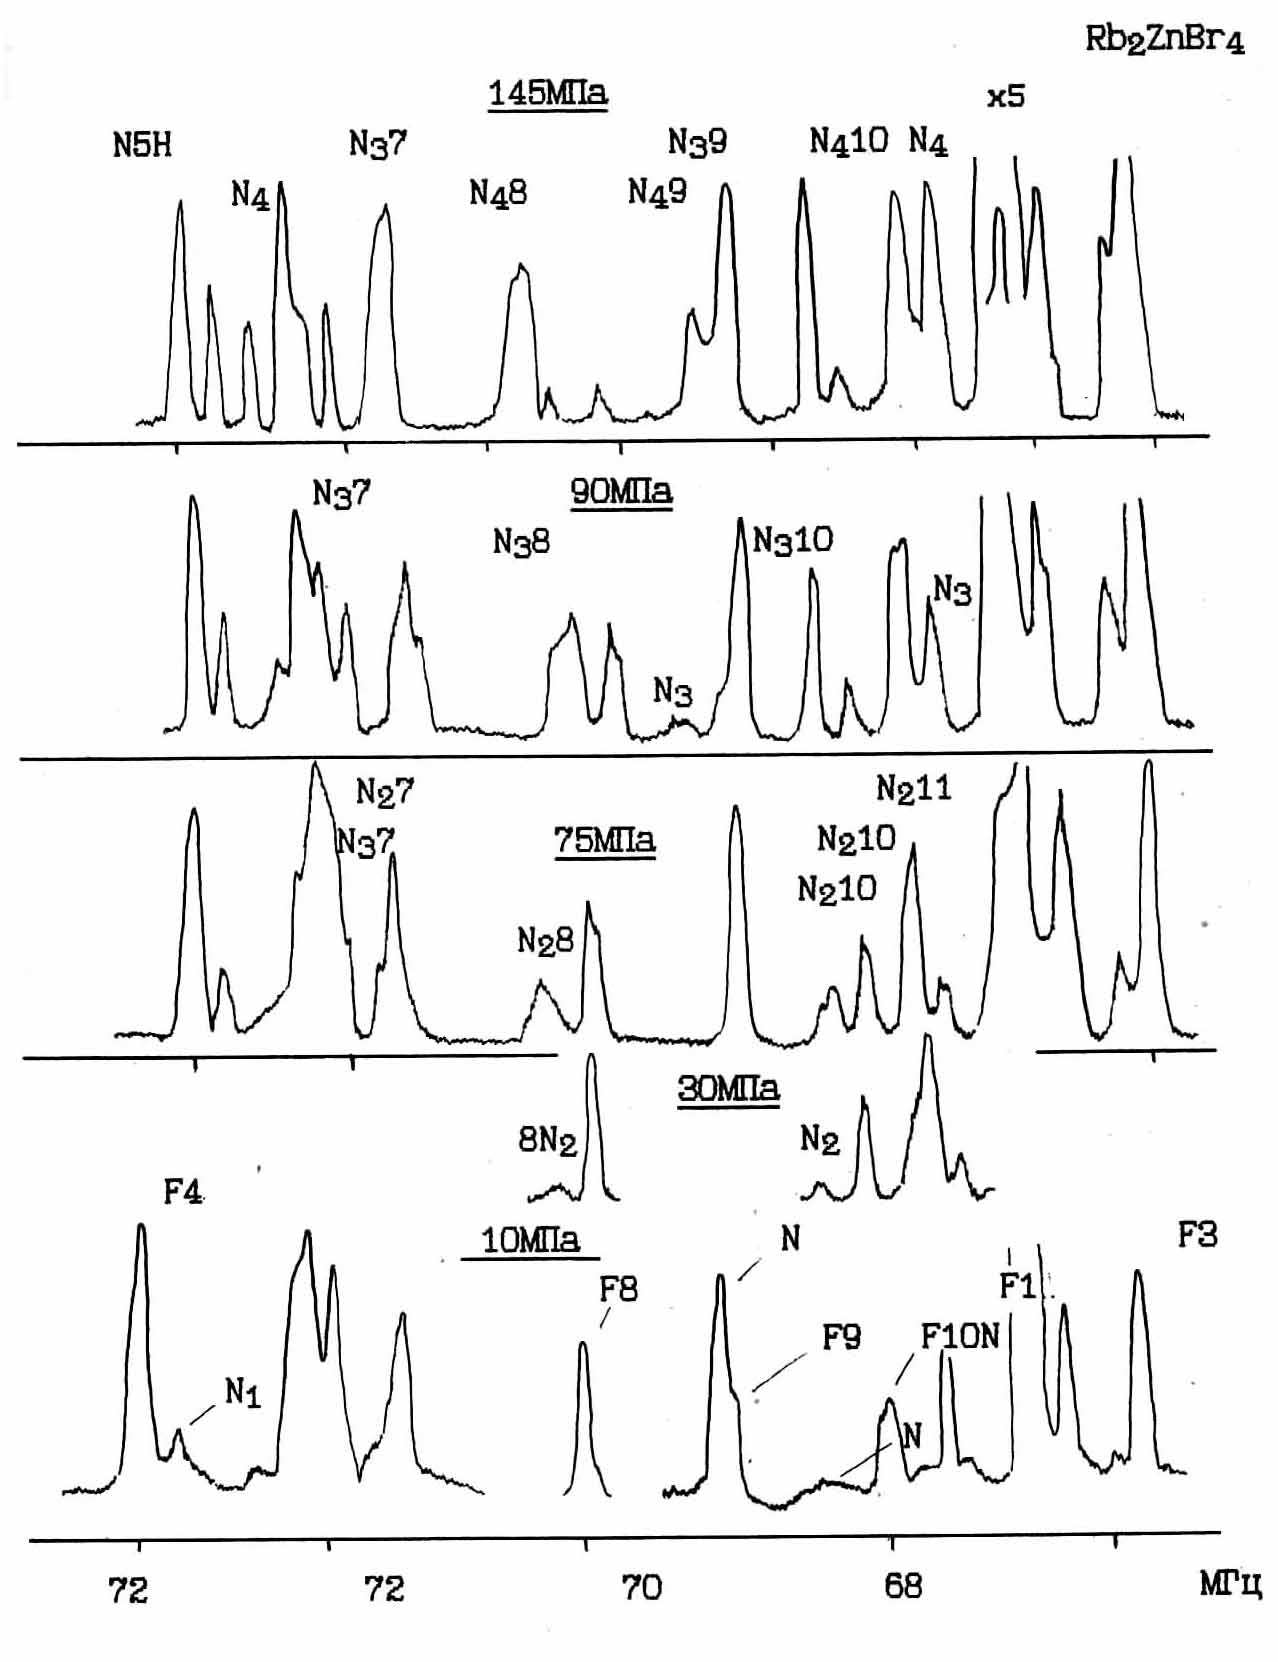
Fig.4.25. Change NQR spectrum with increasing pressure at T = 1890K.
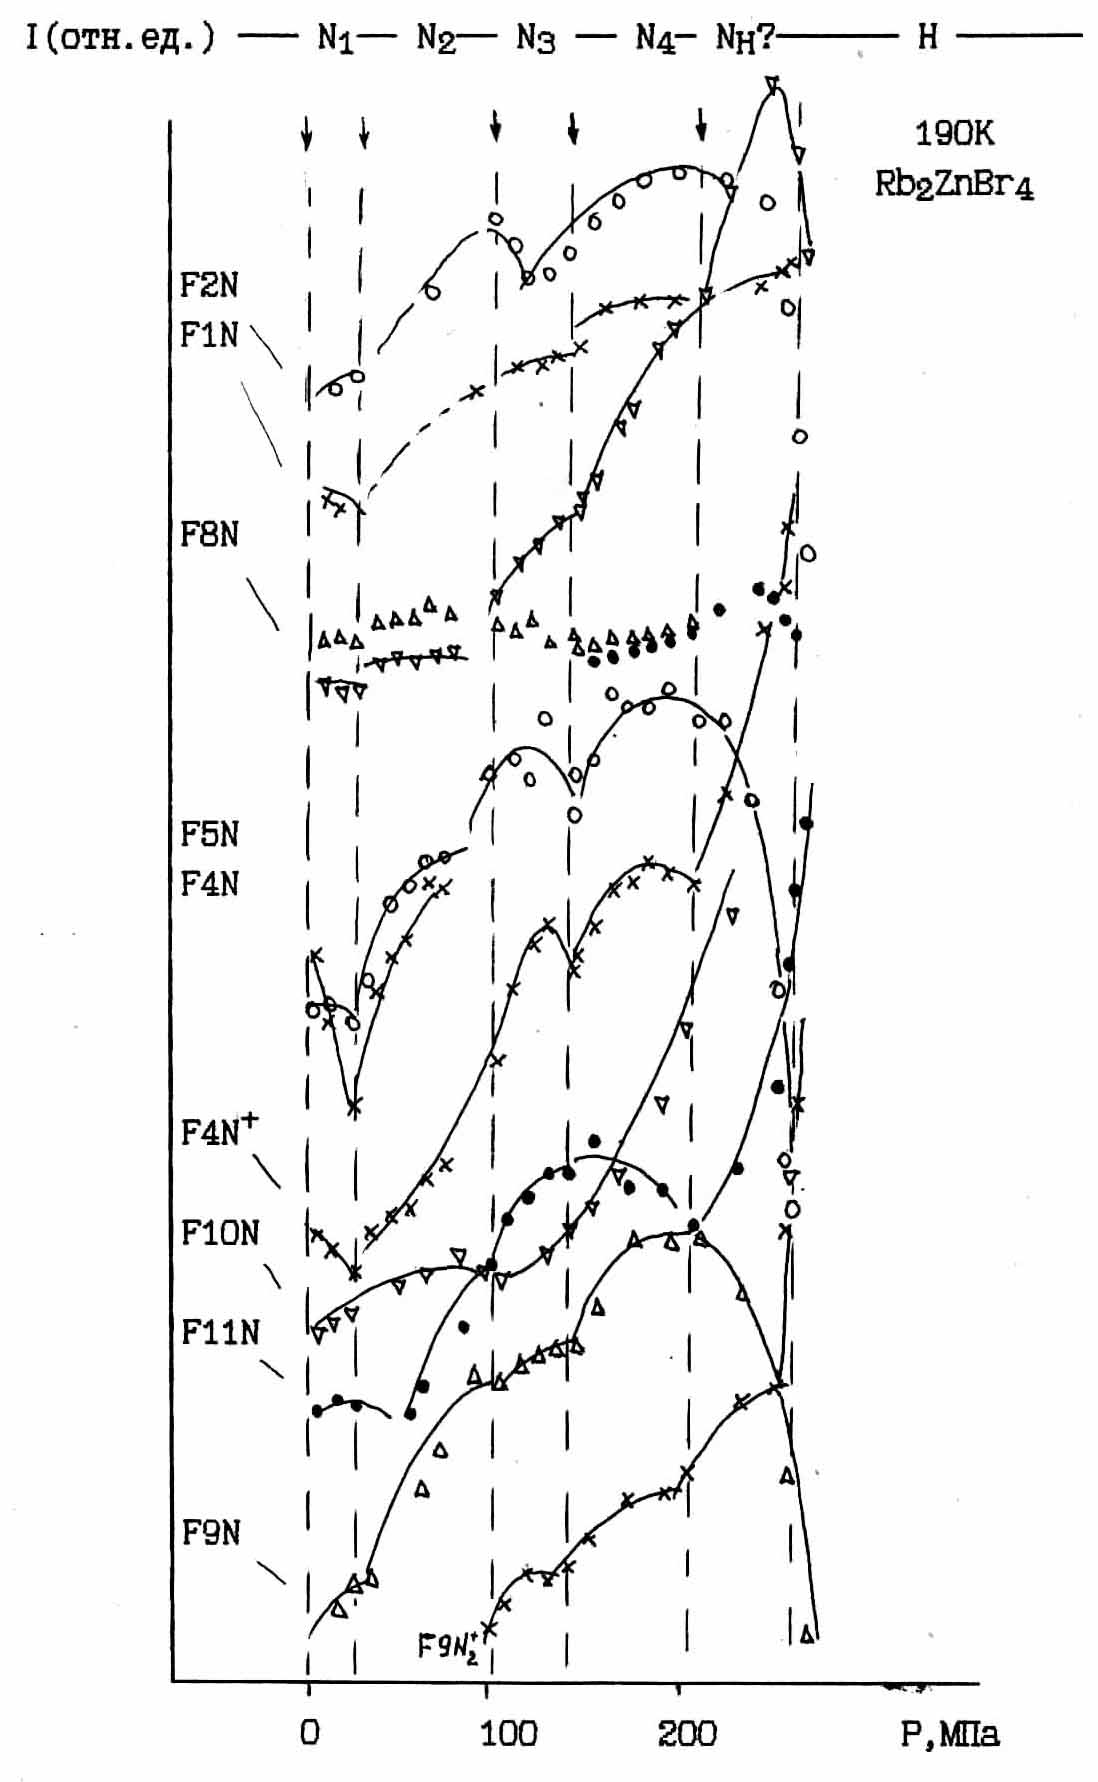
Fig.4.26. Relative change the peak intensities of spectral lines at T = 1900K.
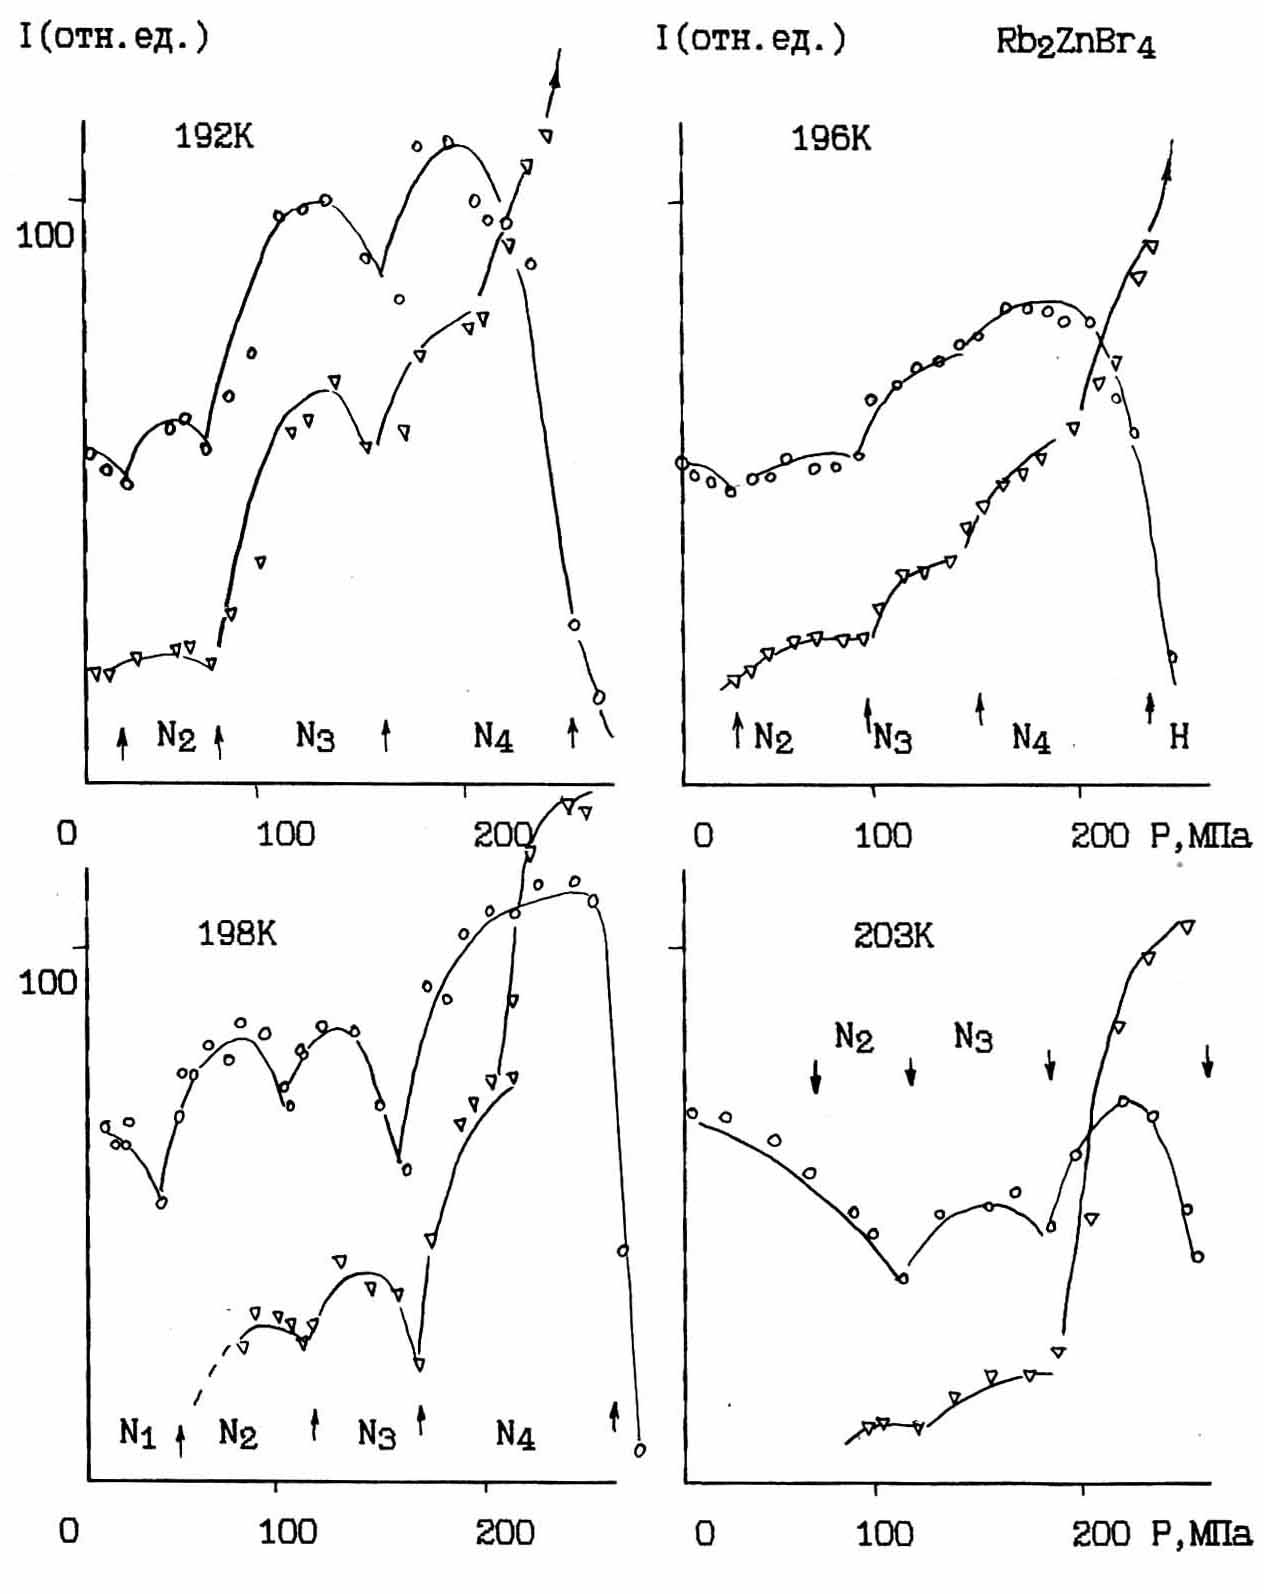
Fig.4.27.Changing the peak intensity of the spectral lines of N4 (o) and 4 N+ (Ñ) at different temperatures.
Close during the specified behavior was observed intensities and isobaric studies Fig.4-5, Fig.4.12. Although the temperature scanning step was relatively large (~3-50K ), but the graphs Fig.4.12, where, in contrast to [115] are all the experimental points, also noted nonmonotonic variation of intensities between Jc and F phases. Besides sensitivity of the isothermal measurements controlled NQR rapper. Therefore, we are quite confident we can assume that celebrated anomalies associated with structural features, rather than instrumental errors.
Noting the arrow (on Fig.4.26 and 4.27) and symbols (for Fig.4.28) P-T conditions of the most distinct breaks and lows in the intensities of the pressure passages, we got the P-T diagram line Fig.4.28.
Turning next to the consideration of changes in the spectra observed in the PT field. With increasing pressure along different temperatures (isotherms 189, 190, 192, 195, 1980K ) in the spectrum in the process of conversion to the NQR lines, and H-type F, exhibit a number of features that can be most clearly illustrated by changing the shape of a single line on the N9* 59 MHz frequency and Fig.4.29 Fig.4.30.
On Fig.4.29 shows the change of the line shape N9 in 190¸ 2000K from 1 atm to 150MPa. In the upper left part of the figure in the high pressure line N9 has a well-defined asymmetric shape with two maxima of amplitude resolution. In the middle part at lower pressures asymmetry observed on the other side of the line, which is clearly seen in atmospheric changes in a heat chamber at maximum sensitivity (Fig.4.8).
Pressures above 100¸150MPa at an asymmetric location wing appears and grows on the new part of the spectrum intensity, so that at higher pressures, there is a doublet, which at the transition to H phase disappears to form a line H12. When the temperature is lowered through the N→F transition distribution N9 is also converted to equal intensity doublet, at a frequency of one component of which is formed ferroelectric line F9, Fig.4.30.
Analysis of the frequency redistribution of intensities within the contour line N9, assuming that it is formed by the overlap of two singlet components of varying intensity, allows
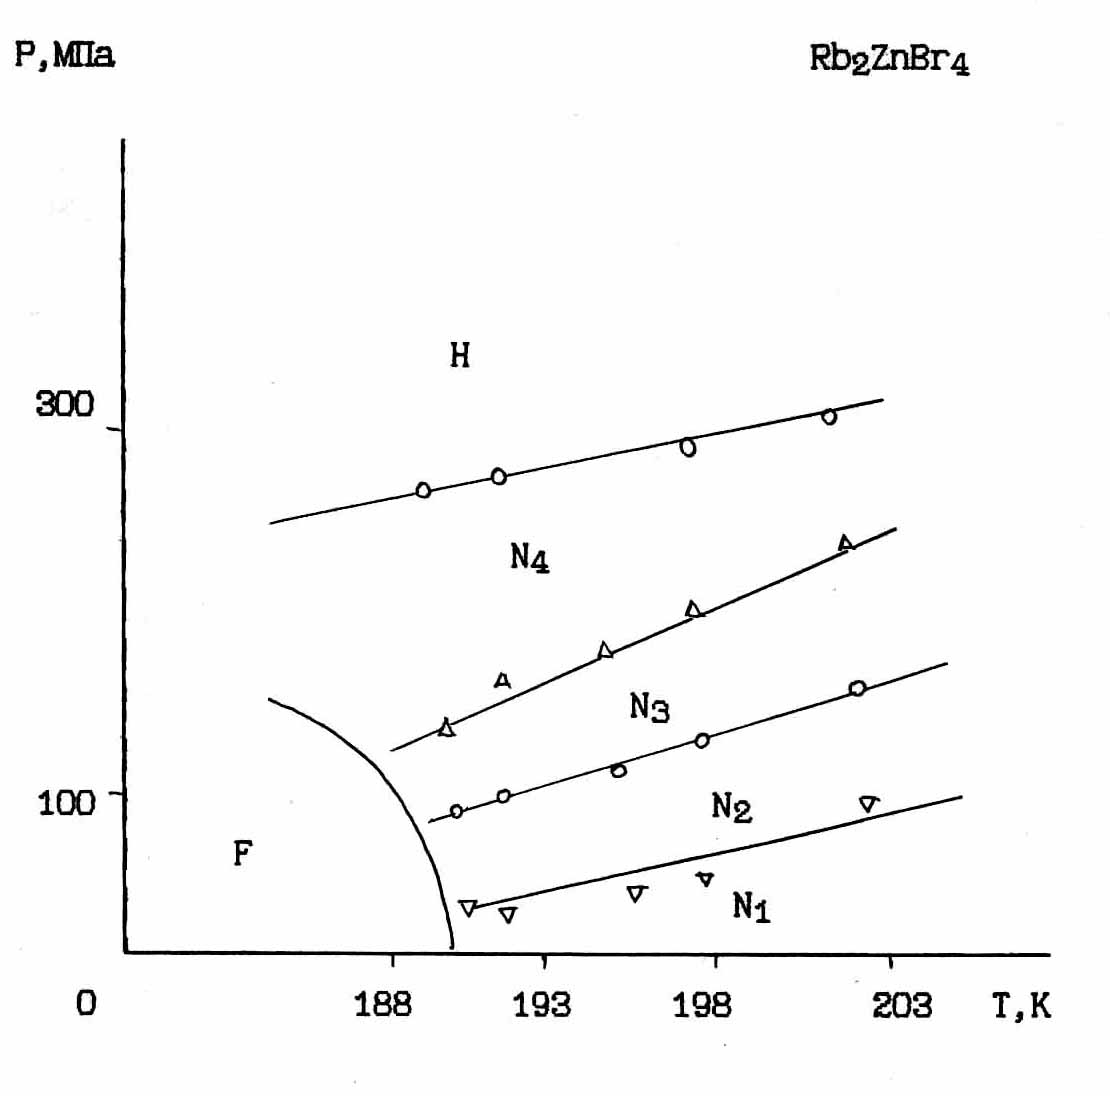
Fig. 4.28. P-T field Jc phase near TC marked by anomalous change of the line intensities of the NQR spectrum.

Fig. 4.29. F9-N9 TC . Variation of the spectral line shapes of type F9-N9 near TC.
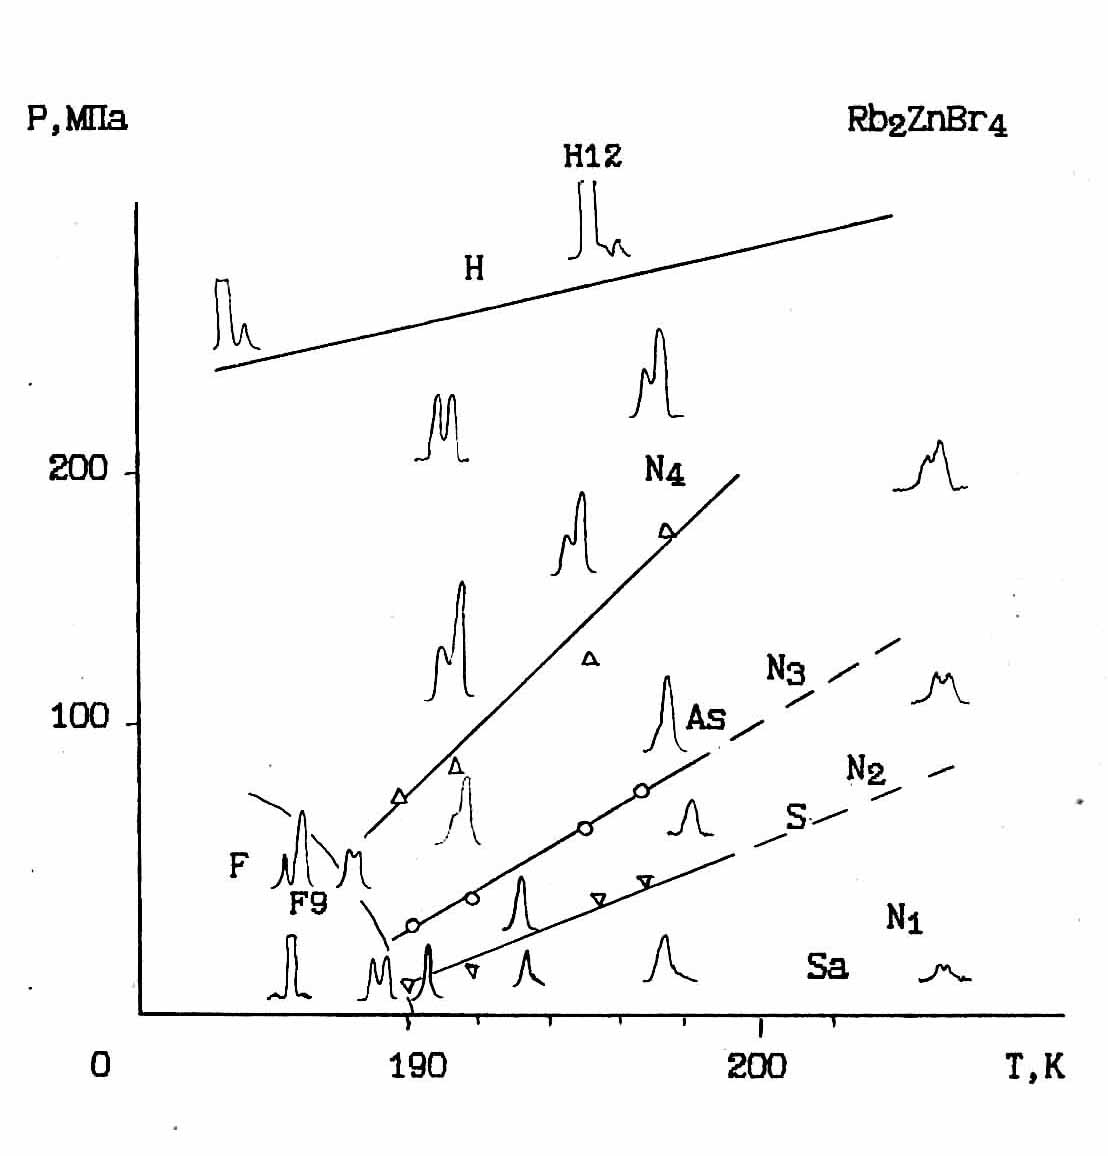
Fig.4.30. P-T field with varying degrees of asymmetry in the line F9-N9-H12.
present in the form of the frequency dependence of the three components (Fig.4.17).
Position P-T lines constructed by the kinks in the course of baric intensities (Fig.4.28) correlates with P-T lines separating regions of different asymmetry line N9 (Fig.4.30). The line attributed symbol (D) corresponds to the transition to the amplitude resolution of the doublet form N9.
Comparison of changes in forms of individual spectral distributions in various P-T areas also indicates that areas with identical terms of NQR structure arranged along the lines of having positive values ∂P/∂T.
Model analysis of the full range of NQR is beyond the scope of this work. However, we try to make an initial discussion. Isothermal passages in HPC2 at low pressures showed that the phase transition Jc general form of the spectrum in a very narrow neighborhood before TC (2¸30К¸ 60MPa) differs from atmospheric pressure. Along with the NQR lines of type N, recorded at atmospheric pressure (which we assigned here, the index N1), other-marked line, which we denote the index N2 Fig.4.32. Changing forms of spectral distributions can be represented by the assumption that near each of the 12 lines of type F, close to the frequencies is a few lines of type N1 and N2. With increasing pressure, the intensity of the lines of N2 increases, and the line intensities of the N2, within certain limits vary slightly. Some of the lines are close in frequency, and the peak intensity of the course in this case should be determined by the different contributions.
A similar redistribution of the intensities observed at the transition to the regime of heating in the pressure 100MPa, Fig.4.33. In this case, the change can be represented by overlapping the three groups of spectral lines, as illustrated in Fig.4.33 for the spectral distribution FN8.
At temperatures above TC, where the NQR lines of the phase F is absent, the spectrum at low pressures presented overlapping lines of type N1 and N2, Fig.4.34 (a-h).
As the pressure increases in N above 80~150MPa range transformed to Fig.4.25d Fig.4.34i-r. His change can be interpreted as the appearance within the contours of spectral distributions of new lines of type N4. Characteristic features of the changes are: a) design of asymmetric
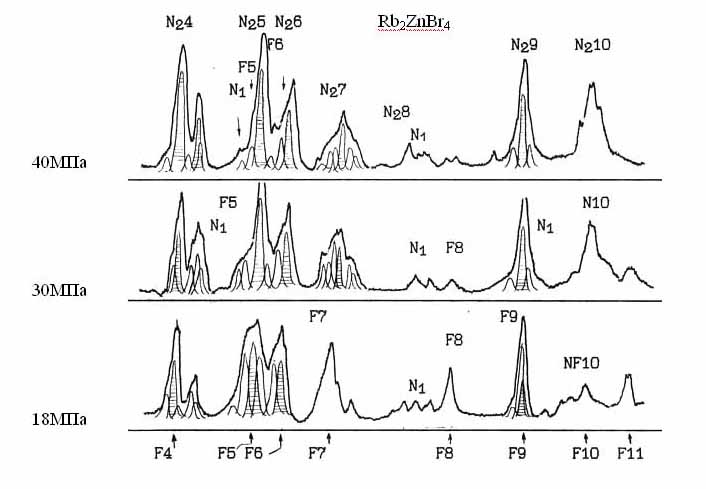
Fig.4.32. Analysis of changes in the shape of the NQR spectrum Br near atmospheric pressure at T=189.50K .
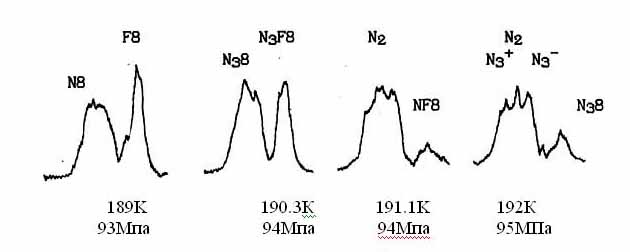
Fig.4.33. Change line NQR spectrum N9-F9 when the temperature changes. P = 100MPa.
line wing N9 (ν=68,98 MHz), b) the emergence of low-intensity lines N3+8, in characteristics redistribution of intensities of lines in the group N5-N7 and N10-N12, etc. Then in the world designated as N3 shape of the spectrum with respect to stable.
Pressures above 110-200MPa, where there is a third anomaly during the peak intensities, also notes changes in the spectrum. Asymmetric line wing N9 is made in a separate spectral component N+4 9er. Change appreciably other spectral distribution (Fig.4.34s-h). The above P-T line separating the region of the N 3 region designated by us as N 4, a broad range of P-T interval is (Fig.4.34s-h).
The slope of the pressure stroke frequency of certain lines (Fig.4.19). Higher pressures (> 250MPa) phase transition is observed in the phase of H (see § 4.2) tracked the fine structure of the NQR spectrum and notes anomalies in its change in the temperature range 190--2100K it possible to identify the P-T phase diagram of N1, N2 , N3, N4, we (in the framework of the "devil" and the stairs in accordance with the data of X-ray diffraction) was interpreted as a manifestation of stages or phases D'Starcase high-order symmetry (HOS) [113,114], and the lines near phase transitions in the area of triple points observed at the coexistence of at least two or three adjacent phases. The magnitude of the coexistence region (shaded region Fig.4.35) and the number of phases is determined by the direction of change of P-T parameters and degree of symmetry.
In (NH4)2ZnCl4 and (NH4)2ZnJ4 where change was observed in the multiplicity of NQR spectra from 16 to 12 absorption lines with narrow temperature intermediate phase, X-ray diffraction at atmospheric pressure are also recorded sequence Jc - 1/4 - 2/7 - 1/3 [47], Figure 1.6, Table 4.1 (p.158).
Interpretation of the data presented NQR was quantitatively tested on samples of Rb2ZnBr4 of the same series of crystallization [119]. On the basis of the reactor international scientific center of Orsay (France), measurements were made of the position of the wave vector qδ in P-T region of its evolution in F and H phase method by neutron diffraction [119].
Interpretation of neutron data at atmospheric pressure X-ray diffraction data does not contradict the study [110] about the existence of near Jc values qδ, which may be
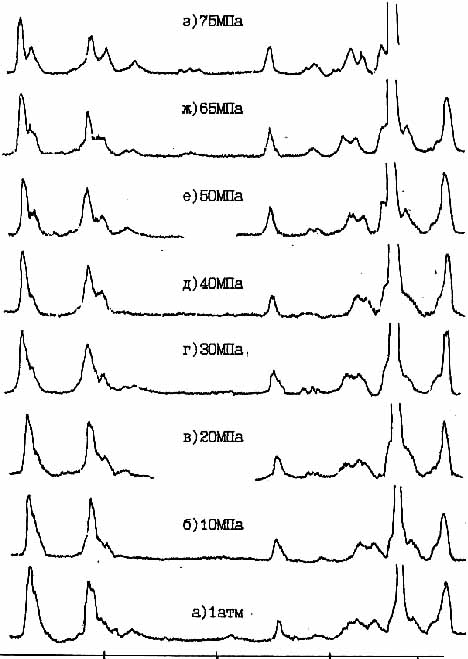
Fig.4.34 a-з. Detailed change in the total NQR spectrum at T = 1940K and pressures from 1 atm to 75 MPa.
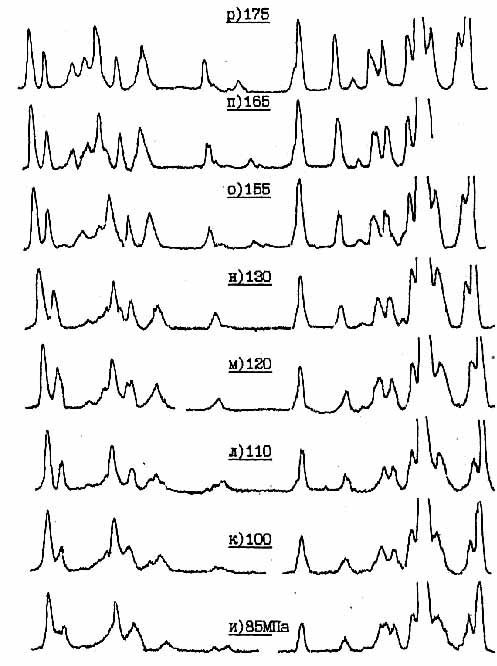
Fig.4.34 (и-р) Detailed change in the total NQR spectrum at T = 1940K and pressures from 85 to 175 MPa.
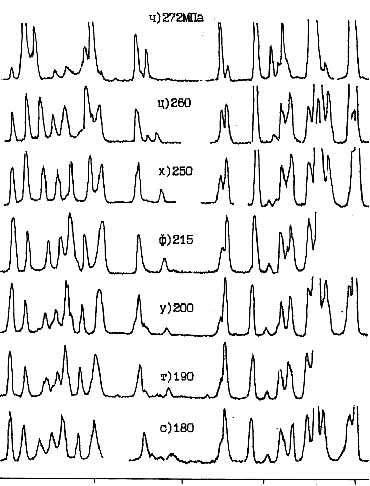
Fig.4.34 (с-ч). Detailed change in the total NQR spectrum at T = 1940K and pressures from 185 to 300 MPa
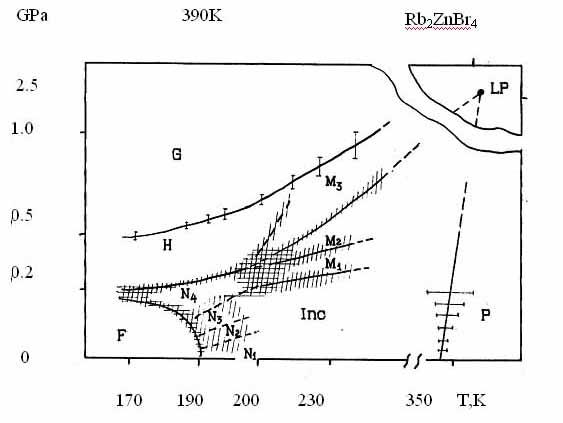
Fig.4.35. General view of the phase diagram of Rb2ZnBr4 according NQR Br.
conventionally disposed at steps "going up" ladder: 5/17 → 3/10 → 7/23 → 4/13 → 5/16 → 1/3 (in the unit. a*).
With increasing pressure, has been confirmed, detected previously [115], lock-in the phase transition orthorhombic symmetry Pn21a , with a cell volume quadrupling (Z = 16) with the value of qδ = l/4 (0.2500). While additionally observed values qδ = 0,296, 0,2917, 0,2857, missing at atmospheric pressure. These values qδ authors of [119], following we [113] compared stairs going down stairs: 3/10, 8/27, 5/17, 7/24, 2/7, 1/4. In this region of the incommensurate phase was marked by the coexistence of two or three satellites in Jc phase diagram. (Satellites 1/3 (0.3329) 5/16 (0.3114) 5/17 (0.2948) 7/23 (0.3043) 7/24 (0.2917), Fig.4.36). At the same time, according to data NQR noted preferential coexistence of three satellites at isobaric aisles near T C and two satellites under isothermal. Also large widths were fixed caliper with cooling, and the continuous change in the position, especially at low pressures. However, the scattering profiles were slightly different from the X-ray [51], a smaller width and temperature region of coexistence. Slightly different conditions and observations: for neutrons pressure was about 1 kb, and X-rays at atmospheric pressure. According to such an NQR contrast at low pressures from outside the structure indicates difference at atmospheric pressure of 1atm under the atmospheric 1tm at TC. In the middle part of the incommensurate phase observed continuous decrease in the magnitude of the wave vector qδ with increasing pressure (from 0.293 to 0.28 at T = 2730K , P <300MPa) and a slight increase in qδ at low temperatures (from 0.2017 (5/17) to 0.300 with P ≈l.0 MPa, 273 <T <200K). According to the measurement of NQR and neutron diffraction authors [119] was constructed P-T phase diagram (Fig.4.37), which is well distinguished from the proportionate phase wave vectors of 1/3 and 1/4 and the region with the higher order phases. The phase transition between phases 1/3↔PDHS and PDHS↔1/4 exactly coincide with the P-T lines between phases F↔N and N↔H fixed NQR. In the PDHS (phases D'Starcase high-order symmetry), where there is a coexistence of satellites, proposed a hypothetical phase diagram presented a set of conventionally separated pseudo incommensurate structures. However, according to another inclination NQR observed, compared with the data NQR P-T lines, separating regions of high phase order.
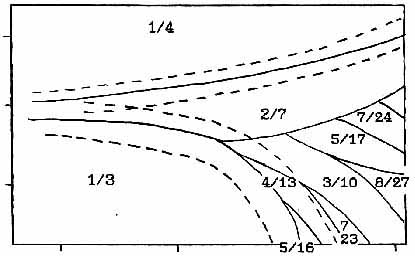
Fig. 4.36. A phase diagram of Rb2ZnBr4 near TC of analysis neutron diffraction data.
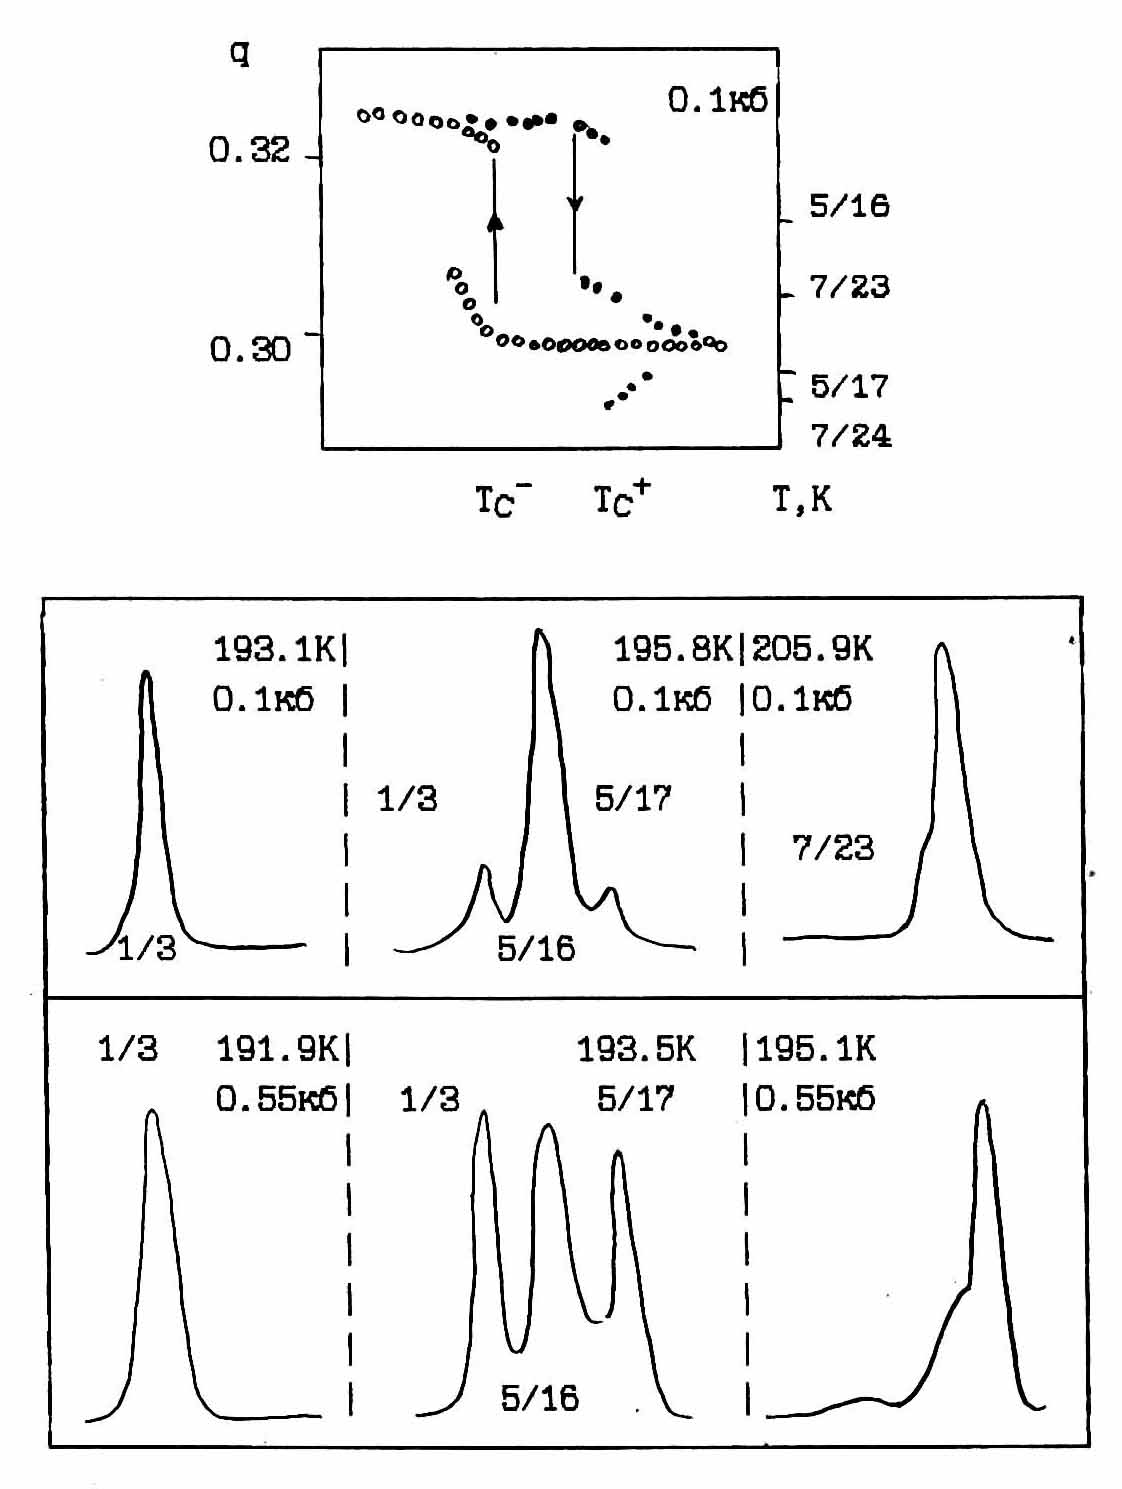
Fig. 4.37. Scattering profiles and repositioning the satellites according neutron diffraction scattering.
English abstract .pdf download § 1.1 § 1.2 § 2.1 § 2.2 § 3.2.1 § 3.2.2 § 3.3 § 3.4 § 4.1.1 § 4.1.2 § 4.3 § 4. 4 References