SHEMETOV YEVGENY. STUDIES OF PHASE TRANSITIONS IN THE UNITED A2BX4 STRUCTURE β-K2SO4 METHOD NUCLEAR QUADRUPOLE RESONANCE
English abstract § 1.1 § 1.2 §1.3 § 1.4 § 2.1 § 2.2 §2.3 §2.4 § 3.1 § 3.2 § 3.3 § 3.4 § 4.1 § 4.2 § 4.3 § 4.4 Reference Template pdf abstract
§ 3.3 NQR Studies of phase transitions in (NH4) 2ZnJ4.
Synthesis and crystal growth tetrayodtsinkata ammonium author performed using chemically pure NH4 and ZnJ2, which were taken in stoichiometric ratio, a method of evaporating an aqueous solution and melt ive.
In the first case, crystallization is carried out at a temperature of 2930K under conditions of low atmospheric moisture for 10-15 days.
Depending on the variation of the starting components of various crystallizations were prepared with different crystal habit. When r excess NH4J grew predominantly hexagonal prismatic crystals with a diameter of 5 mm. With excess ZnJ2 obtained lamellar intergrowths willows crystallites up to 25 mm in length. To remove any residual crystals were washed with a solution of a chemically neutral fluid. A homogeneous melt of colored iodine compound, which after grinding and annealing was a light gray powder. An x-ray test crystals with hexagonal form the habit of no interest.
Methods of NQR investigations was the same as described above. Temperature measurements were carried out in 380-77K.
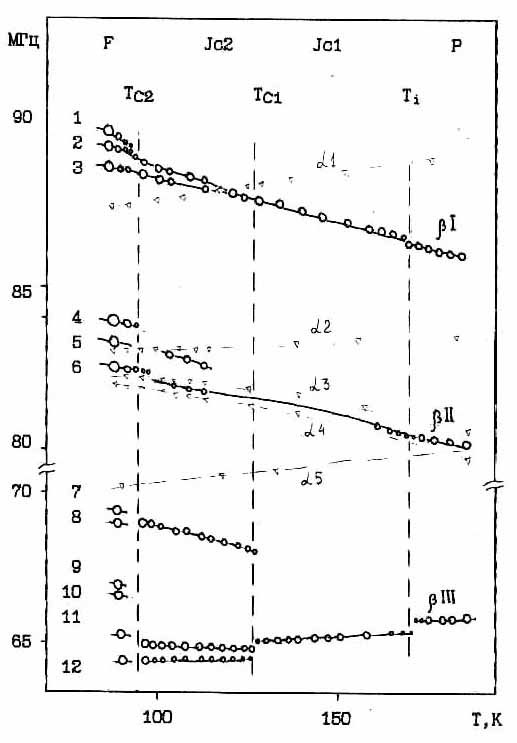
Studies have shown [92] that observed at room temperature from6 to 8 NQR lines at 77 and 16 lines of varying intensity. Analie number and intensities of the spectral lines samhles different methods of growth and crystallization allowed to correlate them on two structurally different states. So to a certain structure and spectral lines correspond to type νaI - νa5; and-other structure in lines νI, νII, νIII (in-line). Fig.3.11.
Later studies were conducted on samples two N1 and N2. From sample Nl at T-2900K fixed intensity of the NQR lines at frequencies νa1 - νa5 and structure, and from the sample N2 simultaneously observed NQR signals of a and β-structures in proportion intensely about 1:1. At 770K from both samples were also observed and in-line type NQR, and from sample N1 signals approaching the noise level of the spectrometer. Upon annealing the samples (T = 380K) within 4 hours, an increase in the intensities of the NQR signal type b.
Spectral line type and traced throughout the temperature range and do not have any anomalies in the temperature dependence of ν(T) (dashed lines in Fig.3.11) and intensities I(T). Stroke frequency NQR lines in the linear type to T) 1700K with I/T = 34,5; II/T = 14,8; III/T = -2,0 kHz/0K. Ti - 1650K At a temperature Ti - 1650K anomaly in the behavior of the spectra. Peak intensities of the lines ν and νIII diminish lines and νI νIII when passing through the Ti vary in frequency (Fig.3.11). The second anomaly is observed at Tci = l26K, where there is a change in the multiplicity of the spectrum. The low-frequency component is split into three lines with an intensity ratio of ≈1:2:1, and the high frequency components pass into the two NQR lines each. When the transition 1/2 - 3/2 fixed 12 NQR lines 127J.

Fig.3.11. Temperature dependence of the frequency spectrum of the NQR 127J in (NH4)2ZnJ4.

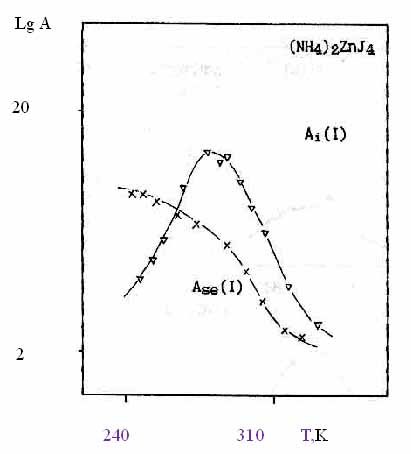
Fig.3.12. . Changing the values of the amplitudes Ase and Ai in (NH4)2ZnJ4

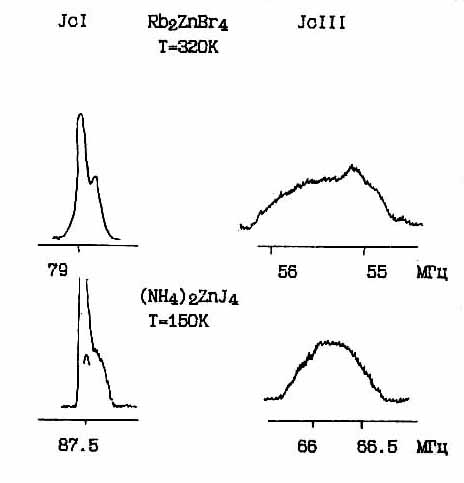
Figure 3.13. The comparison of the NQR spectra of Rb2ZnBr4 and (NH4)2ZnJ4
Temperature changes in the group of high-frequency lines indicate the temperature of the third spectral anomaly : ТC2 = 87+2К.
At temperatures 210-3700K NQR signals from b state of the crystal are observed as a spin-eco signal Ase, and in the free precession signal decay Аi. With increasing temperature, the amplitude of signal Ase for all of the component ν. Fig.3.12 spectrum decreases, and the amplitude ratio of Ase(I) :Ase(II) : Ase(III), characterized by the ratio of 1:1:3. ; Amplitude A increase of the noise level and reaching a maximum at T≈310K, fall at higher temperatures. After annealing the sample at T > 3100K and subsequent cooling, the quantities Ase and Ai decrease in size, but restored after low-temperature cycles. Such changes in NQR spectra reflect the resonant nature of the observed relaxation of nonequilibrium phenomena. However, due to technical limitations, these affects on this compound investigated is not sufficiently clear.
Based on a comparison with the data obtained by this NQR for compounds Rb2ZnBr4 (Fig. 3.13, etc.), Rb2ZnCl4, Cs2ZnJ4 and other assumption was made that the investigated compounds belong to the structural type β-K2SO4 symmetry transformation of the scheme:
1650K 1260K 870K
D2hl6(Pnma) Jcl Jc2 C2v9(Pn21a)
(Z=4) (Z=12)
V=l V=3
The phase between 126 and 870K interpreted as disproportionate, rather arbitrary, and is likely to increase in the period phase qS = 2/5 or 3/8) and the symmetry Pn21a.
Focus on a comparison of the spectral data obtained by us NQR with similar data for other compounds A2BHal4 (Hal = Cl, Br, J) and consider-their compliance with femenologicheskoy model [34], proposed to describe the shape of the resonance lines in the incommensurate systems.
Table 3.1 shows the known NQR data for compounds A2BHal4 with an incommensurate phase. These data include: 1) the relative splitting of the extreme components of the spectrum near Ti: I-III = [I-III]/III ; 2) the values of the temperature coefficients of l/n*∂n/∂T
Table 3.1
|
β -А2ВHal4 |
νI МHz |
νIII МHz |
ΔνI-III % |
1/ν*(dνI/dT) |
1/ν*(dνo/dT) |
νI / ν0 % |
TQ1 (ms) |
TQ2(μs) |
|
(NH4)2ZnJ4 (AZJ) |
87.0 |
66.0 |
31 |
3.9*10-4 |
-3*10-5 |
280 |
150 |
<100 |
|
(NH4)2ZnBr4 (AZB) |
66.0 |
61.5 |
<26 |
3.0*10-4 |
-1.9*10-4 |
400 |
160 |
<100 |
|
(NH4)2ZnCl4 (AZ0) |
9.8 |
8.0 |
<27 |
2.6*10-4 |
+1.3*10-4 |
|
1000 |
500 |
|
Cs2HgCl4 (CHC) |
14.15 |
11.68 |
≈22 |
positive |
negative |
|
- |
- |
|
K2ZnСl4 (KZC) |
9.94 |
8.08 |
≈20 |
positive |
negative |
|
600 |
<200 |
|
Rb2ZnJ4 (RZJ) |
|
|
>19 |
positive |
|
|
|
|
|
Cs2HeBr4 (CUB) |
93.5 |
78.6 |
19 |
2.3*10-4 |
+1.6*10-4 |
|
|
|
|
Cs2CdBT4 CCCB) |
65.9 |
57.36 |
15 |
positive |
positive |
|
- |
- |
|
Cs2CdJ4 (CCJ) |
83.2 |
71.5 |
16 |
7.4*10-5 |
+ 4*10-5 |
|
100 |
<50 |
|
Rb2ZnBr4 (RZB) |
64.0 |
55.0 |
16 |
2.5*10-4 |
0 |
320 |
|
|
|
Rb2ZnCl4 (RZC) |
9.7 |
8.3 |
16 |
4.4*10-4 |
+2.4 10-9 |
|
|
|
|
Cs2ZnJ4 (CZJ) |
79.5 |
73.9 |
7 |
7.4*10-4 |
+1.5-10-4 |
200 |
400 |
<100 |
|
Cs2ZnCl4 (CZC) |
|
|
8 |
modulation Cs to NMR [127] |
|
|
||
|
Cs2ZnBr4 (GZB) |
62.73 |
67.62 |
9 |
no Jc ? |
|
|
|
|
|
Rb2CdCl4 (RCC) |
|
|
|
structure Immm |
|
|
||
3) the average half-width of the resonance signals latched by spin-echo above Ti ; 4) The maximum values of the relaxation times TQ1 and TQ2 the position I Pnma structure of the compounds studied, where the nucleus of halogens.
Comparison of the relative spacing between the high frequency νI and νIII low frequency NQR lines in the high-temperature phase near Ti, shows that the largest amount of splitting DνI-III celebrated for ammonium compounds (up 31%) and the smallest for cesium (up 7%). This fact is explained by difficult from the standpoint of crystal, because radius of the cations NH4, Gs and close in magnitude and indicates that the cleavage is determined sufficiently dynamic environment nucleus halogen. Some correlation of splitting DνI-III observed size of the halogen atom: for compounds А2ВHаl4 same A and B, the splitting decreases with decreasing radius Hal. Due to the fact that the "smaller" Hal atoms polarizability than this may indicate a significant chemical (electronic) contribution to the nature of this splitting. At temperatures close to TС and 770K major outer frequency splitting observed in average in the compounds with the larger ions. This is in agreement about the importance of data on the dipole-dipole interaction in these compounds. Nor is there any patterns between types of atoms B (Zn, Cd) and the general character of the temperature dependence of frequency: when changing varieties atom B, is transferring to another compound crystallochemically or structural class. This implies that the stability of the tetrahedron defined by the electronic environment.
Significant linewidths temperature phase indicate the presence of structural or chemical disorder in these crystals. Suggest the following details in shape. HalI spectral distributions (the position of the nucleus in the structure of halogen I Pnma). If in Cs2ZnJ4 line shape in the position of Jc faze HalI presented low-intensity and high-intensive low frequency component, the compounds of RZB, CHB, CCB, CCJ observed reverse arrangement in the intensities of these components.
In this case, cesium bromide intensely ratio of these components is about 20, and in the second part CCJ only observed when TC low intensity as a small wing . As will be described in Chapter 4 of RZB in increased pressure in the Jc phase component intensity ratio discussed approaches unity and becomes comparable with the add-on for AZB and AZC. Since the shape of the line is determined, in particular, the transverse spin relaxation (TQ2), to a marked difference indicates a different character dynamic environment nucleus deviated from position I (II and III) structure Pnma. Most clearly seen when compared Cs2ZnJ4 with other cesium analogs.
Temperature dependence of the frequency below Ti unusual and can not be explained by known types (rotary, Vibratory, torsionalny) atomic motions. In the nature of the temperature slope of the NQR frequencies in compounds A2BX4 celebrated their graduation large values of sharply positive for high frequency components, to smoothly negative for the lower frequency component of the NQR spectrum. This, along with other data about indicates significantly different character movements and dynamics of structurally nonequivalent nucleus Hal.
When comparing our data with the results of stationary NQR methods [37, 44, 45], there are significant differences. It follows from our relaxation measurements of the TQ1 and TQ2 due to the fact that when using the latter can be detected only homogeneous (long-lived), contributions to the absorption signal, whereas the use of spin-echo technique allows us to observe inhomogeneously broadened signals. But even in the latter case there are time limitations instrumental that does not allow enough correct record form broad frequency distributions, as in the case of Cs2CdJ4, even with an increase in sensitivity of the method, the signals in the Jo-phase is not fully observable.
Briefly summarizing the results of NQR spectral data presented in this chapter, we can note the following: First, the experimental data obtained under static spectral characteristics indicate a fundamental difference in the nature of their temperature evolution compared to phenomenology model [34]. Secondly, there is a significant impact on the nuclear dynamics observed frequency spectral characteristics of NQR.
Time measurement TQ2 spin-spin relaxation in Cs2ZnJ and Rb2ZnBr4 [103,109] indicate the need to consider the temperature change of the width of the singlet spectral line in Jc phase, whereas in the existing model, the width of individual components of the continuum distribution was chosen to be the width of the line paraelectric paraphase .. However, NQR data for Cs2ZnJ4 (and especially our studies RZB [109]) shows that this assumption is not always competent, since the relaxation times and TQ1 TQ2 in Jo phase фазы increase rapidly with decreasing temperature, and the intensity of the two end peaks for all of the observed frequency distributions near Тi болееdifferent than an order of magnitude. The observed shape of the spectra are not always the result of hardware distortion, since the relaxation time T Q2, at least at low temperatures Jo phase, the relation TQ2 >t1; tint; t2.
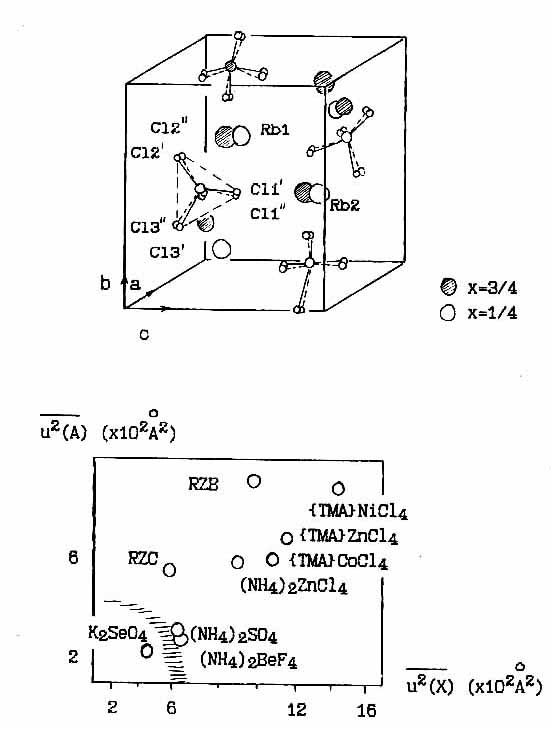
Comparing our data with the X-ray data on the measurement of the mean square displacements of atoms in tetrahedral ZnCl paraelectric Rb2ZnCl4, where it was established that there are two equal-probable provisions tetrahedra into each other by the libration movement (Fig.3.14) and summarizes literature data on the values of the mean square displacements of atoms in the other A2BX4, to some extent consistent with those of the NQR and Raman [42] that the phase transition P-Jc in the compounds studied close to the type of order-disorder. It should be noted that not form symmetric spectral distributions comparable to those observed by us, detected RF methods and systems of other crystalline, such as in compounds with CDW charge density waves (see e.g. 2H-TaSe2 [95,96]), used ion conductors with superlattice ordering (Ag2HgJ4 [97]), organic-dimensional conductors CHx-trans [98] etc. [100]) and even in solid helium-3 not [99]. In all these cases, the observed asymmetry of the resonance line was associated with the anisotropic diffusion of spin or charge against the backdrop of two large-scale spatial or temporal scale. Similar forms registered by EPR in the study of the vibronic interaction A and orbital states in complexes with octahedral symmetry [102]. Overall data analysis allows to chart a path radiospectroscopy explanation NQR experiments in this class of compounds in the direction of electron-nuclear movements in two ambitious timeline.

Fig.3.14. a.) Libration movement ZnCl44 tetrahedra in the high-temperature phase Rb2ZnCl4 according to [41].
b) standard deviations of the atoms grade A and X for certain compounds A2BX4 at room temperature.
English abstract § 1.1 § 1.2 §1.3 § 1.4 § 2.1 § 2.2 §2.3 §2.4 § 3.1 § 3.2 § 3.3 § 3.4 § 4.1 § 4.2 § 4.3 § 4.4 Reference Template pdf abstract