SHEMETOV YEVGENY. STUDIES OF PHASE TRANSITIONS IN THE UNITED A2BX4 STRUCTURE β-K2SO4 METHOD NUCLEAR QUADRUPOLE RESONANCE
English abstract § 1.1 § 1.2 §1.3 § 1.4 § 2.1 § 2.2 §2.3 §2.4 § 3.1 § 3.2 § 3.3 § 3.4 § 4.1 § 4.2 § 4.3 § 4.4 Reference Template pdf abstract
§ 4.1. The absorption spectra of NQR 79,81Br in the incommensurate phase at atmospheric pressure.
When NQR study of compounds with incommensurate phases in which there are significant non-equilibrium processes, it is necessary, in particular, have procedures quantitative measurement of the resonance absorption signal for given values of other parameters (T, t, ν, etc.). Such a technique can be designed based on coherent spectrometers. Spectrometer type ISSH the absolute accuracy of the amplitude of the transient resonance signal is small. Therefore, in the research process was used to monitor the intensity of the reference method, which consists in comparing the magnitude of NQR signal recorded at different sample metaequilibrium state, with the value of the equilibrium signal, structural stability of the sample. When working with Rb2ZnBr4 was matched standard эталон, which amounts to less than 10% volume filling of the receiving coil, and the slopes of the temperature and frequency dependences of the pressure of the two NQR lines absorption were sufficient for calibration.
With this methodological technique were significantly clarified the conditions for obtaining reproducible measurements, and also found some side effects. Thus, it was observed that the absolute peak intensity of the NQR signals from the original Br annealed sample Rb2ZnBr4 increases the amount of accumulation of cooling cycles. However, subsequently, when samples originally uncontrolled contact with moist atmosphere, the intensity of the spectra of incommensurate structure decreases again, and in addition, there is the appearance of three absorption lines, which we have designated νH, νС, νB . The appearance of these NQR signals, as was explained, due to the excessive influence of atmospheric moisture on the state of the sample. At the same crystal structure of the sample is gradually transformed into another polymorph. Some samples when grown from aqueous solution completely or partially crystallized in this modification, and there is a complete or partial modification of this transition in prolonged contact with moist atmosphere samples.
To elucidate the nature of this phenomenon, measurements were made on the content of crystalline bound water in these compounds, NMR. The results of measurements are structurally bound water (with an accuracy of 2%) was not detected. With the use of X-ray diffraction studies, and considering the NQR signal intensity ratio 1:2:1 (relaxation times are within the time resolution of the spectrometer), it was found that the structural modification (α) has the space group symmetry P21/m (Z = 2). Upon annealing the samples above 3000K structure Pnma symmetry is restored. Thus β-modification is thermally induced metastable modification of Rb2ZnBr4. The frequency dependence of the NQR lines νH, νC, νB modification α-Rb2ZnBr4 is presented in Figure 4.1, together with the general progress of other NQR frequency signals from both Br isotopes for -modification.
In addition to the absorption signals in some cases a special form of the NQR spectrum in the high frequency region of the spectral distribution of the isotope 79Вr β-modification (ν ≈78MGz) and additional weak lines at the frequencies 79 and 80MHz. These lines, we denote the index of νx νy νz . Figure 4.1 and 4.2. As explained, these signals were a homogeneous signals recession free process. Their presence was not related to the existence or absence of the share structure of α-Rb2ZnBr4 in the samples. Particularly clear signals νx, νy and νz manifested after the application to non-hydrostatic deformation patterns. After removal of the load was fixed shape of the spectrum shown in Figure 4.2. As the temperature decreases the frequency of induction of these signals almost coefficients of l/*∂/∂T; 3) the average half-width of the resonance signals latched by spin-echo above Ti 4) The maximum values of the relaxation times TQ1 and TQ2 the position I Pnma structure of the compounds studied, where the nucleus of halogens.
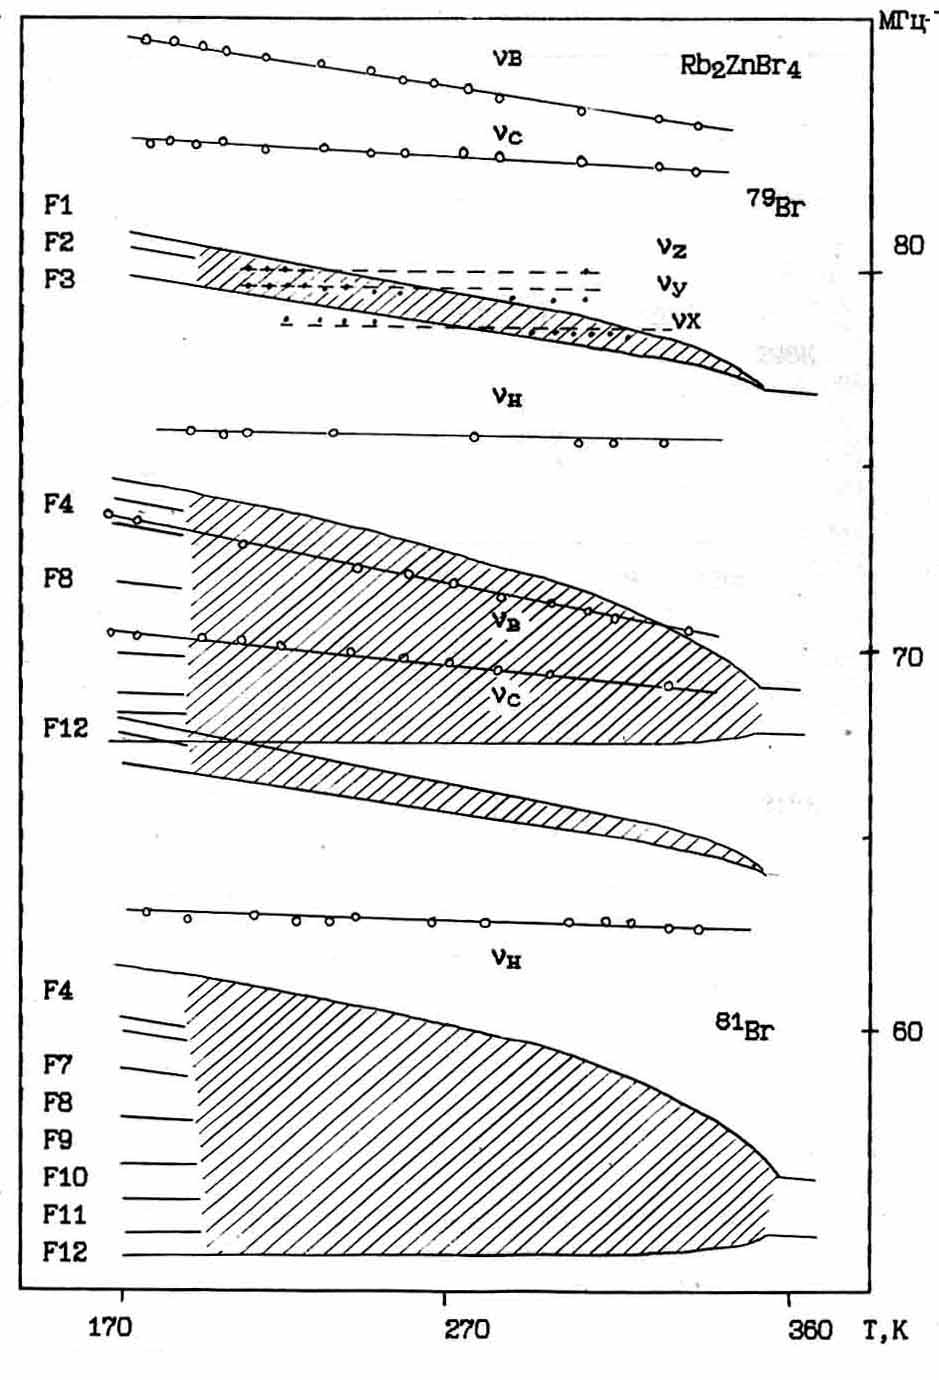
Figure 4.1. Scheme NQR lines in Rb2ZnBr4 at atmospheric pressure.
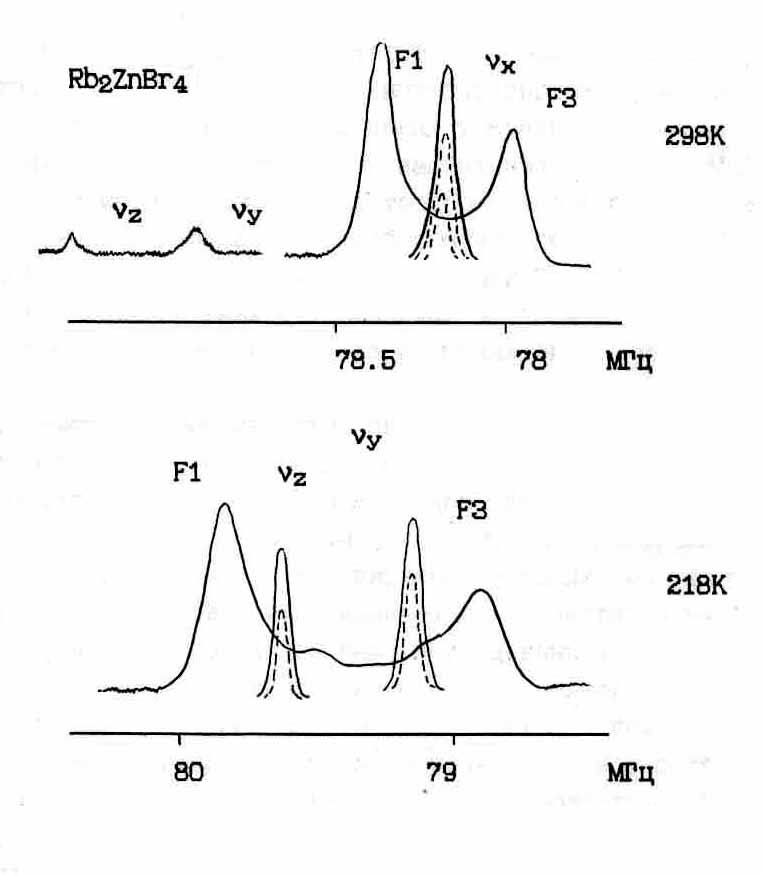
Figure 4.2.View of the 79Br NQR spectrum from samples of Rb2ZnBr4 in a stressed state.
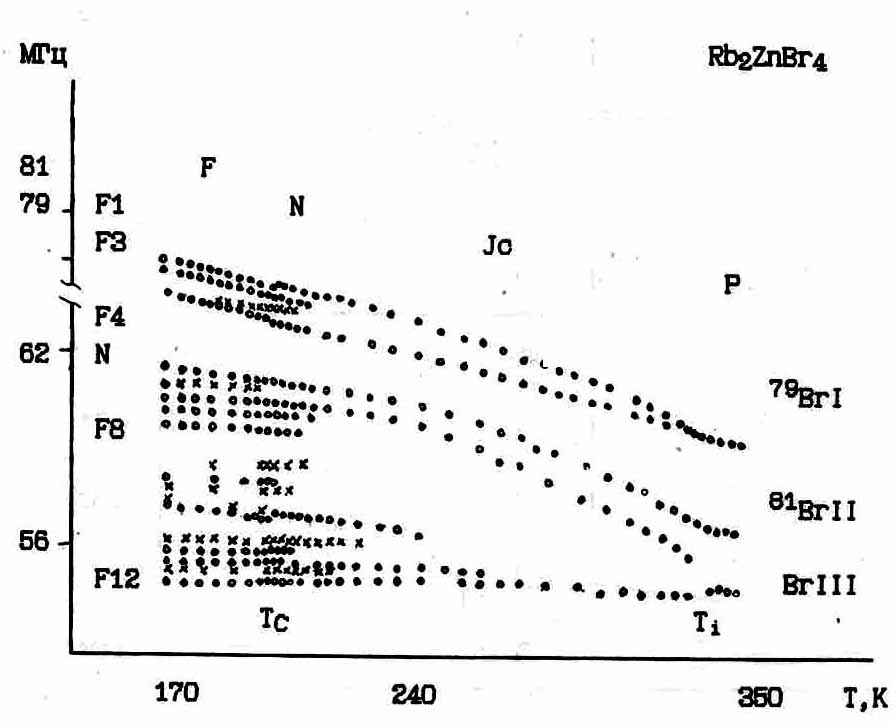
.4.3. Full temperature dependence of the NQR frequencies Br in Rb2ZnBr4 at atmospheric pressure.
Explanation of this effect is beyond the scope of this paper. We note only that it can be interpreted as the result of cross-relaxation absorption of certain levels, resulting from nonuniform external voltage with quadrupole levels incommensurate structure tetrabromo zincate rubidium [102].
Thus resulting mining measurements were found:
1) Existence of polymorph Rb2ZnBr4-α .
2) Impact deformation induced, and also accumulated in the process of crystallization or cooling cycles, the state of voltage samples Jc-phase.
3) The dependence of signal intensity on the amount of cooling cycles in the incommensurate phase.
These results were considered in the preparation of samples A2BX4 to research in atmospheric and high pressure method of optimal matching, to which we shall now describe.
Most of the results of research carried out in the following conditions precluding the manifestation above mentioned effects.
Better signal-noise ratio in terms of liquid-gradient thermal stabilization allowed us to meet precision NQR measurements metastable β modification RZB with an incommensurate phase, to clarify and supplement the results published previously [38]. On Fig.4.3 shows the temperature dependence of the NQR frequencies obtained by the author in the temperature range 390-150K. As can be seen in the high-temperature region near Ti managed to track more accurately the frequency dependence of the spectral components Br NQR Fig.4.4. Since the frequency of edge peaks of the spectral distribution of the position of the nucleus Br in the Jc- phase lie above the experimental points of the NQR frequency of the nucleus in paraphrase: JC phase in the course of the frequency observed in the form of "beak", which is typical for phase transitions with the fluctuation splitting [107]. In the NQR frequencies of nucleus BrI and BrII was monitored more reliable
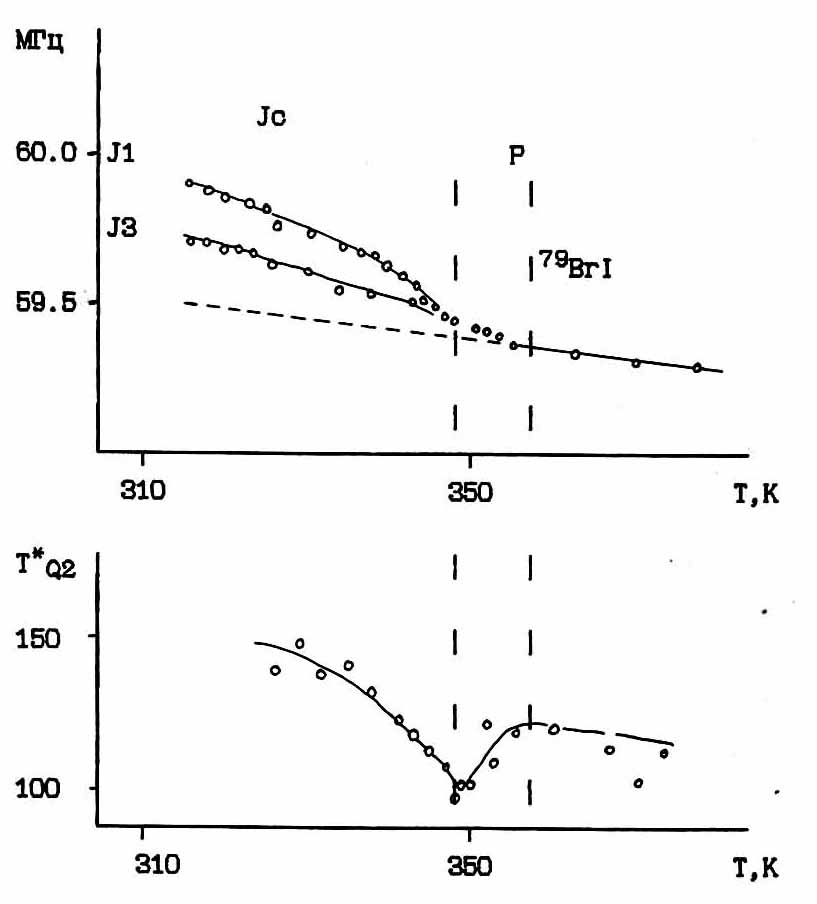
Fig. 4.4. Splitting NQR frequencies the high frequency line and change line width near Ti.
frequency dependence of the splitting. In the region 56MGz below Ti, we observed a wide frequency distribution, without any trace of the continuum. It was further found that the NQR signals in the paraelectric phase contain both homogeneous and heterogeneous components. In this case the spin-spin relaxation time TQ2S and TQ2L of these contributions are at the limit of time resolution of the spectrometer (≈20ms ).
When measuring the width T*Q2 is most intense line νl, marked difference of its low temperature dependence into a temperature at which the inflection is observed in the frequency dependence of Fig.4.4.
In Jc phase is observed in the behavior of Mild feature spectra, consisting in a slight change in the shape of spectral distributions near 2400K . At the same time-frequency spectral shape blurred in 56 MGz (Fig. 3.13) smoothly into a spectral form with three amplitude maximum allowed.
Below 2200K near TC transition in the spectrum detected NQR lines not previously observed. Their frequencies are sufficiently close to the frequencies previously recorded signals. These lines have a smaller intensity and are marked (x) in Fig.4.3 and 4.5a [108,115]. On Fig.4.5 shows the change in the intensity of the line at the frequency ν=56.8MGz (line F10) and lying next to the new line. With decreasing temperature, initially appears and grows in intensity the new component. Its intensity reaches its maximum value to TC, stabilized in the 30K and decreases with the passage of TC. Appearance and increase in intensity line F10 occurs only near TC at T ≤ TC +300K . The maximum intensity is achieved below TC-50K and then remains constant.
Near the high-TC shape distribution at frequencies 80-78 MHz (Fig.4.6) has at least four components, the central part of the distribution sags to the noise level just above TC. The recording of this spectrum (Fig.4.6.) To improve school performed with great frequency sweep and under tstrobe ≤ Т2* и t2 ≈ TQ2 ,so the circuit broad line with a short value TQ2, oscillations are observed are associated with the apparatus function or gate integrator [126], or with the effects of the polarization of nuclear dynamics [106]. Omitting the finer details of the line shape,
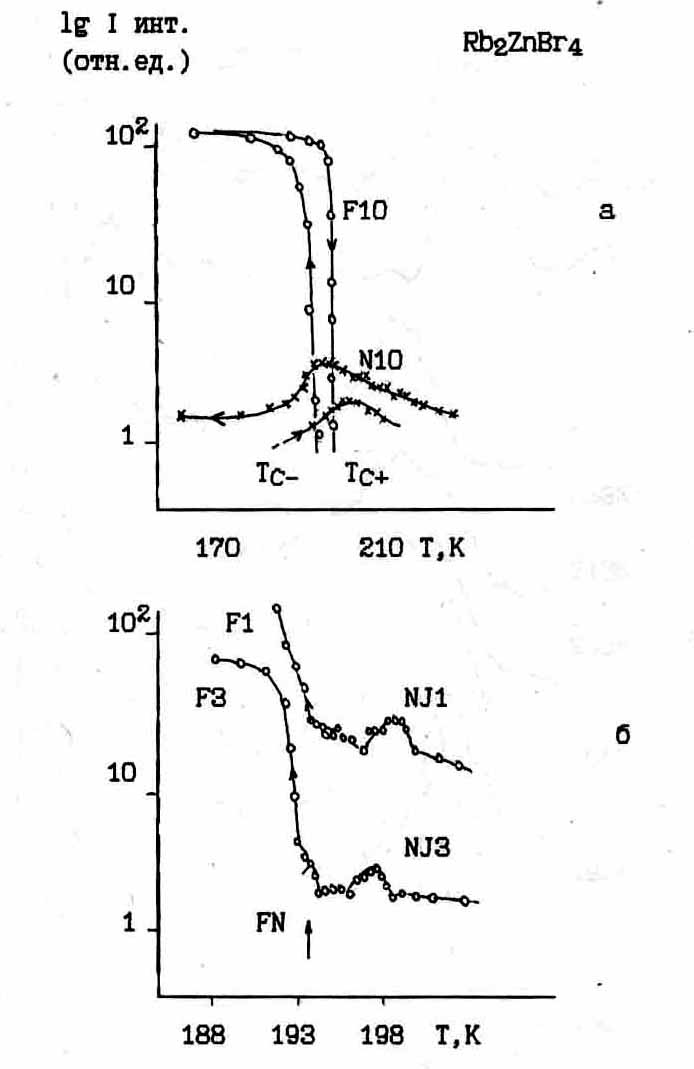
Fig.4.5. Temperature variation of the peak intensities of the lines F, N, and "mixed" type near TC in Rb2ZnBr4.
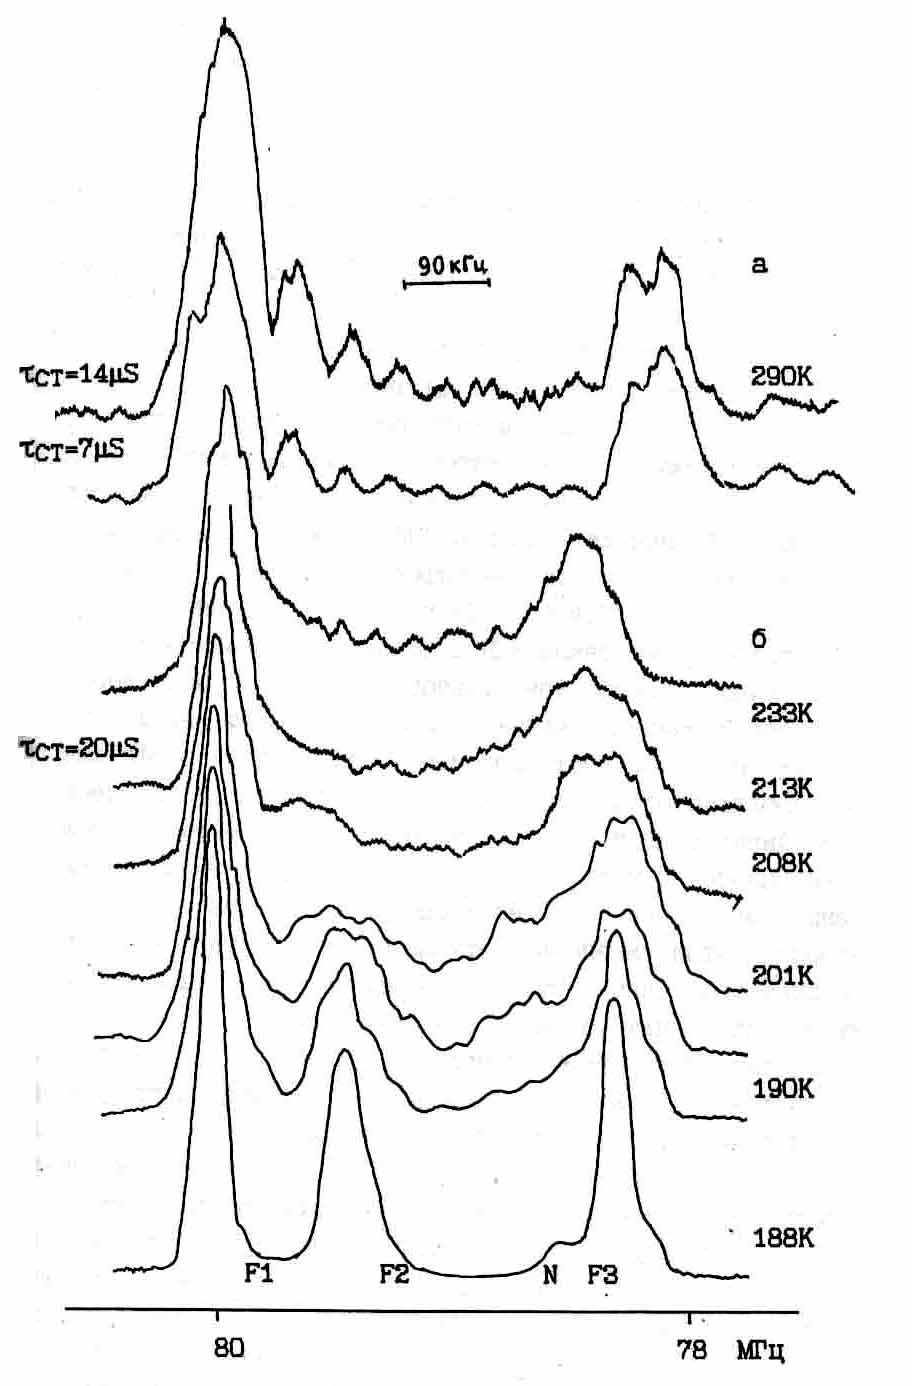
Fig.4.6. 79Br NQR spectrum of the position BrJ structure with special recording conditions: a) isolation; ) b) non-isolated gate pulse
We note in this fourth component of the spectral distribution. With precision studies optimal matching method in this mode were obtained accurate temperature frequency dependence of the spectral components of F1-F3 and N 79Br NQR spectrum Fig.4.7.
Behavior of the intensities of the remaining lines is quite similar to that shown in Fig.4.5, but most of them overlapped with other components of the spectrum, while the temperature-variation of peak intensities of lines located at frequencies overlapping areas, is nonmonotonic Fig.4.56. There is a shift of the NQR frequencies while passing Best TC measurement accuracy enabled to detect the temperature hysteresis of frequencies, for example, lines F1 and F3 (Fig.4.7).
This change in NQR spectra can be represented as a transformation of an incommensurate phase lines (lines of type J) through the N-type spectral lines to twelve lines F ferroelectric. Lines formed in the immediate vicinity of the ferroelectric phase TC, and do not follow continuously through the transition, as it was previously thought [34]. This is most clearly observed in the group of lines F8-F11 and close lying lines N type. In the frequency overlap lines F and N TC recorded at small frequency peak races overlap (Fig.4.7). Nonmonotonic behavior of the intensities and frequencies of the lines above TC indicates that they are unresolved frequency overlap lines F and N-type (spectral lines overlapped FN type), and at higher temperatures are covered by other types of lines N and J (NJ line type). Last gradually converted to the spectrum of the middle region of the incommensurate phase (Fig.4.8).
These experimental data and data on the measurement time TQ1 quadrupole spin relaxation of Br [103, 109] indicate the need to revise the model proposed in [34] to describe the shape of the nuclear resonance line in incommensurate phases. Fixed structure of the spectrum allows for the interpretation of the line shape in the framework of the existence of long-period structures. In this case, using the expansion of the atomic displacements on the eigenvectors of the soft mode (1.1) we have:
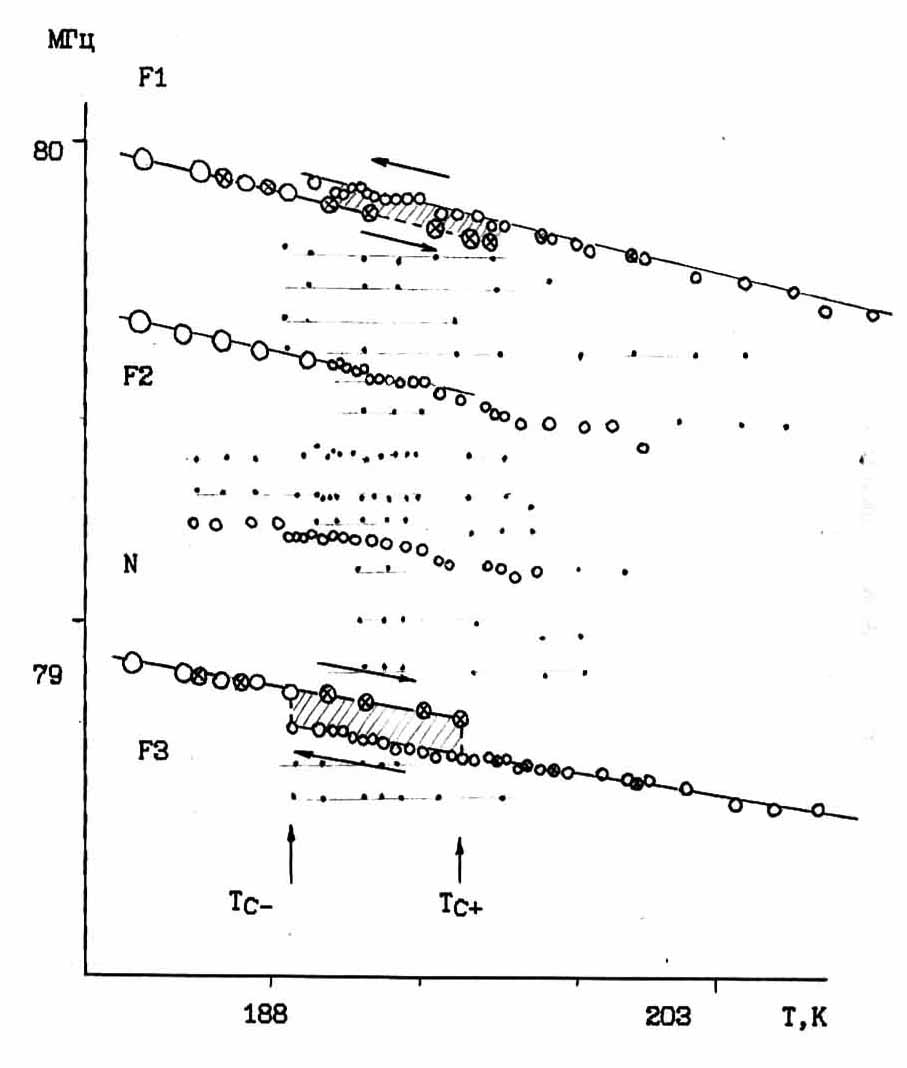
Fig.4.7. Stroke frequencies of the main spectral peaks of the oscillation maxima and the contour line near TC. - Cooling - heating.
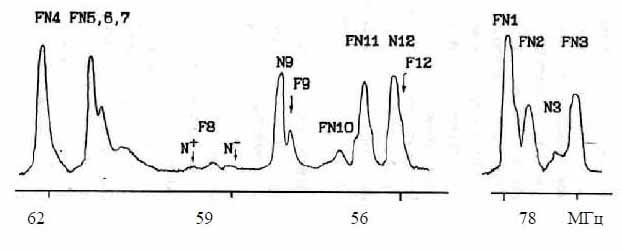
Fig.4.8. View NQR spectrum near T » TC+2K at atmospheric pressure.
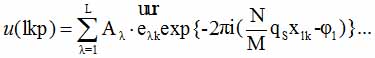 (4.1.)
Spectral density function (1.33) is discrete, and the shape of the line will be the sum of the spectral components of the form g(ν). Taking the calculation of expression (4.1) and in the simplest case, we only consider one rotational mode S10 (A1¹ local approximation, L = l), we calculated the shape of the lines of the long-period structures such as 3/11; 5/17; 5/17; 9/29; 9/29; 11/35, with varying angle φo in shirokovolnovom approximation.. In Figure 4.9 shows an example calculation for modulating 5/17 with different values of φ0. Increasing the width of the original singlet component g(ν) line shape is close to the continuous frequency distribution (dashed line).At room temperature, the estimated line may be adjusted by experimental verification of the continuum on the assumption that modulation of the 5/17 simultaneously coexists with different values of the phase angle φ and introducing corrections relaxation contour line.
In the low temperature region, where the soliton tapered wall and the main structure similar to the crystal structure of the ferroelectric phase to the value of qδ = 1/3, we shall use the expression for the non-linear phase angle φ. The calculations in this case showed that a satisfactory agreement with the experimental line shape can obtain if modulations along with close to 1/3 (5/17, 3/10) briefly introduce a periodic modulation of 1/4, which is indispensable in the local approximation to describe the fourth component spectrum. This assumption means that an increase in the contribution from other modes of symmetry, such as S3, or from a different view, for example, Aq [93], S2 fashion, formally analogous to the introduction of non-local description. On Fig.4.10 shows the calculated line shape is obtained by assuming the coexistence of the modulations with wave vectors 3/10 and 1/4, respectively, taken with weights 4:1:1:2. The coincidence of the calculated and experimental forms, as can be seen from the figure, is quite satisfactory.
Thus NQR data at atmospheric pressure indicate that near TC structure of the incommensurate phase of Rb2ZnBr4 can be
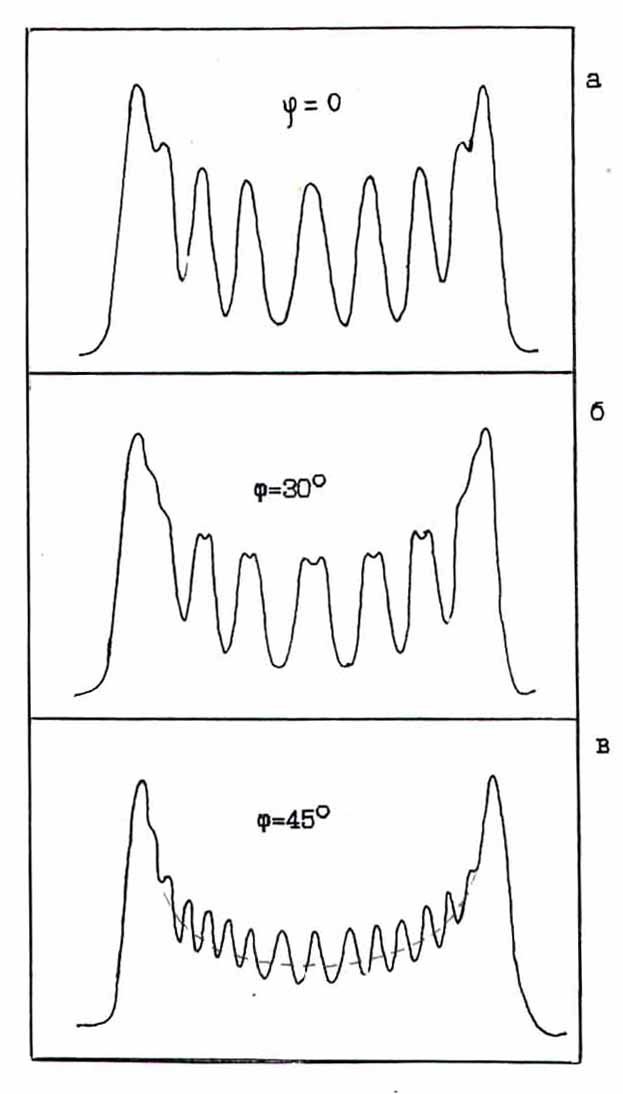
Figure 4.9. Calculated line shape in the long-periodic approximation M / N = 5/17; Aq = 0.
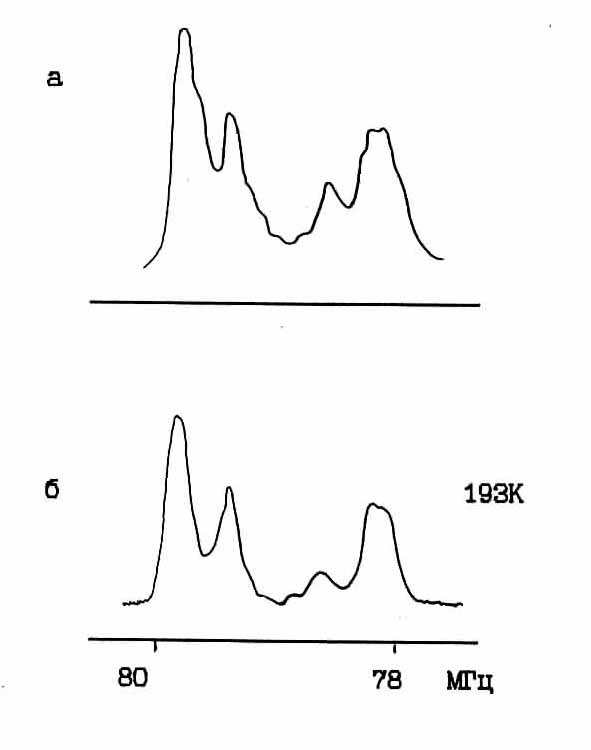
Fig.4.10 a) Calculated line shape in the long-period approximation
Coexistence modulations third; 3/10, 1/4; 5/17; 5/17; 3/10 respectively, with weights of 4:2:1:1 (Aq = 0);
b) Experimental
represented by the coexistence of multiple modulation sequence "satanic stairs. This is not inconsistent (X-ray diffraction data. [110] However NQR data indicate that besides the modulation of 1/3 must be present for at least another one even short-modulation.
For the experimental confirmation of the existence of such a structure, it was decided to expand the area of research through additional parameter - the external hydrostatic pressure. When this was to be expected that in the "devil's staircase" this will change the proportion of one phase at the expense of others, and to facilitate their supervision.
English abstract § 1.1 § 1.2 §1.3 § 1.4 § 2.1 § 2.2 §2.3 §2.4 § 3.1 § 3.2 § 3.3 § 3.4 § 4.1 § 4.2 § 4.3 § 4.4 Reference Template pdf abstract